Since day one of the coronavirus pandemic, the U.S.

has not had enough tests. Faced with this shortage, medical professionals used what tests they had on people with the worst symptoms or whose occupations put them at high risk for infection. People who were less sick or asymptomatic did not get tested. Because of this, many infected people in the U.S. have not been tested, and much of the information public health officials have about the spread and deadliness of the virus does not provide a complete picture.

Short of testing every person in the U.S., the best way to get accurate data on who and how many people have been infected with the coronavirus is

to test randomly.

I am a

professor of health policy and management at Indiana University, and random testing is exactly what we did in my state. From April 25 to May 1, our team randomly selected and tested thousands of Indiana residents, no matter if they’d been sick or not. From this testing we were able to get some of the first truly representative data on coronavirus infection rates at a state level.


We found that

2.8% of the state’s population had been infected with SARS–CoV–2. We also found that minority communities – especially Hispanic communities – have been hit much harder by the virus. With this representative data, we were also able to calculate out just how deadly the virus really is.

The process of random testing

The goal of our study was to learn how many Indiana residents, in total, were currently or had been previously been infected by the coronavirus. To do this, the people our team tested needed to be an accurate representation of Indiana’s population as a whole and we needed to use two tests on every person.

With the help of the Indiana State Department of Health, numerous state agencies and community leaders,

we set up 70 testing stations in cities and towns across Indiana. We then randomly selected people from a list created using state tax records and invited them to get tested, free of charge. Some groups showed up more readily than others and we adjusted the numbers to represent the demographics of the state accordingly.

Once a person showed up to our mobile testing sites, they were given both

a PCR swab test that looks for current infections and an antibody blood test that looks for evidence of past infection.

By testing randomly and looking for both current and past infections, we could extrapolate our results to the entire state of Indiana and get information about real infection rates of this virus.

The research team also worked with civic leaders from vulnerable communities to conduct open, nonrandom testing as well to see how the results of these two testing approaches would differ.

How widespread and how deadly

We tested more than 4,600 Indiana residents as part of the first wave of testing in the study. This included more than 3,600 randomly selected people and more than 900 volunteers who participated in open testing.

During the last week in April, we estimate that 1.7% of the population had active viral infections. An additional 1.1% had antibodies, showing evidence of previous infection. In total, we estimate that

2.8% of the population currently were or had previously been infected with the coronavirus with 95% confidence that the actual infection rate is between 2% and 3.7%.

Because our random sample was designed to be representative of the population of the state, we can assume with almost certainty that the entire state numbers are the same. That would mean that approximately 188,000 Indiana residents had been infected by late April. At that point, the official confirmed cases – not including deaths –

were about 17,000.

Focusing the tests on severe or high-risk people underestimated the true infection rate by a factor of 11.

Having a reliable estimate of the true number of people who have been infected also allowed us to calculate the infection fatality rate – the percentage of people infected with SARS-CoV-2 who die. In Indiana, we calculated the rate is 0.58%. For this calculation, we divided the number of COVID-19 deaths in Indiana – 1,099 at the time – into the total number of people that were determined to have been cumulatively infected at 2.8% of the population – 188,000.

Early estimates suggested that

5% to 6% of cases in the U.S. were fatal, which is similar to the 6.3% that you would get by dividing confirmed cases in Indiana – 17,000 – by the deaths – 1,099. The infection–fatality rate of 0.58% is thankfully far lower, but is nearly six times higher than the seasonal flu which has a death rate of 0.1%.

This random testing also allowed us to make accurate estimates about what percent of infected people are asymptomatic. In our study, about 44% of those who tested positive for active viral infection reported no symptoms. While this was already

suspected by experts, our estimate is likely the most accurate to date.

Race, job and living situation matter

The general trends and information about the virus are incredibly important, but just as important are the ways in which human actions influenced what people are most affected.

We asked every person we tested about their race, ethnicity and whether they lived with someone who was previously diagnosed with COVID-19.

Our analysis of the random sample suggests that COVID-19 rates are much higher in minority communities, especially in Hispanic communities, where approximately 8% were currently or previously infected. While we do not definitively know why, it is possible that members of the Hispanic community in Indiana are

more likely to be essential workers, live in extended family structures that include relatives beyond the nuclear family or both.

We further found that people who lived with a person who was COVID-19 positive were approximately 12 times more likely to have the virus themselves than people living in a home with no infections. Living with extended family and being more exposed due to one’s job may make it easier for the virus to spread within some communities.

These findings, along with the relatively low 2.8% prevalence, suggest that social distancing slowed the spread of the virus in the larger population. However, the hardest-hit communities were those who, on average, are not able to practice social distancing as consistently as others.

What next?

Now that we have this information and have established a baseline, we will continue periodically testing a random sample of people in the state. Doing so will tell us how far the virus has infiltrated our population so that policy decisions can be tailored to the situation.

This is the first statewide random sample study in the U.S. and the numbers offer both points of hope and concern.

The good news is that social distancing worked. Efforts to slow the virus contained it to only 2.8% of the population and by slowing the spread of the virus in the community, Indiana bought some time to determine the best way forward. This provides more time for researchers to both determine the degree to which infection results in immunity and to accelerate the development of a vaccine.

But there is bad news as well. If only 2.8% of the population have been infected with SARS-CoV-2, 97.2% of the population have not been infected and could still get the virus. The risk for a large outbreak that could dwarf the initial wave is still very real.

The demographic distribution of infections, while disturbing, offers important information that can help public health officials direct testing, education and contact tracing resources that are language and culturally sensitive. The research team and the state health department are working with leaders from these communities to figure out how to best contain the spread of the virus in the areas most affected.

As businesses slowly reopen, we need to be vigilant with any and all safety precautions so that we do not lose the ground we gained by hunkering down. Hopefully numbers will go down, but regardless of what happens in the future, we now better know the foe we fight.

Nir Menachemi is a Professor of Health Policy and Management at IUPUI.

This article first appeared on The Conversation. You can find it here.

  • New Russian research suggests that the human lifespan could be up to 156 years
    Photo credit: CanvaResearchers found what's preventing us from living longer.
    ,

    New Russian research suggests that the human lifespan could be up to 156 years

    Humans can live much longer if certain barriers are addressed.

    According to the Guinness Book of World Records, the oldest person lived to the ripe age of 122 years old. Such a lifespan is an incredible feat, but what if the average person could beat that record by 34 years? Recent research done in Russia has led scientists to believe that the average human lifespan could be up to 156 years.

    The researchers at Skoltech Biomed Technologies Center developed a mathematical model that allowed them to “switch on” a variety of aging mechanisms. This allowed them to calculate a human’s lifespan where mortality risk never increased with age. After experimenting with different scenarios and conditions, they found the biggest barriers to longevity were caused by non-renewable tissues and somatic mutations.

    What are these barriers against longer life?

    Somatic mutations are DNA changes within a cell. They accumulate over time during a human’s life and cannot be reversed with any existing therapy. These DNA errors that pile up in our cells contribute to the aging process.

    Many human organs like the liver and skin continually replace cells and regrow damaged portions of themselves. However, there are two organs that can’t do this: the brain and the heart. Brain tissue (neurons) and heart tissue (cardiomyocytes) cannot regenerate. This proves to be the most prominent biological limit that shortens our lifespans. This explains why issues like dementia and heart disease are prominent causes of death and morbidity later in life. Since those organs’ tissues don’t replace damaged cells, they’re prone to irrevocably decline over time.

    “The key finding of the study is the discovery of substantial differences between tissue types. Neurons and cardiomyocytes, which lack the ability to divide, turned out to be the main limiting factors: when all other causes of aging are eliminated, somatic mutations alone reduce the theoretical median lifespan from 1,759 years (for a hypothetical non-aging human organism) to 156 years,” said Evgeny Efimov, a research intern at the Skoltech Biomed Technologies Center, researcher at AIRI, and one of the key authors of the study.

    This suggests that somatic mutations and DNA damage is what ultimately prevents humans from living indefinitely, even if our brains and hearts regenerated cells like other organs.

    So what’s next?

    Now knowing these biological limitations, the researchers hope to study other areas of aging impacting the human lifespan that could plausibly be reversed. This includes mitochondrial dysfunction, telomere shortening, epigenetic drift, and loss of proteostasis. 

    The hope is to have a clearer priority list of issues for future therapies to tackle. This is not just to possibly extend life, but to improve lives in general. By developing a fully comprehensive theory of aging, Skoltech hopes to pinpoint which aspects of aging are within our scope to address. After all, thoroughly studying each puzzle piece that makes up human life gives us a better understanding of the whole.

    Of course, other impactful factors in a person’s lifespan can be addressed today. As most know, things like diet, sleep, and exercise are among them. A person’s living environment can also negatively impact their lifespan if it doesn’t have clean air, access to clean water, and so on.

    For now, the best method for living long is to follow instructions from your physician. Whether you make it to 156 years or not, living well is best for whatever time you’re given.

  • Screen time guidelines for kids and adolescents have shifted as research paints a more nuanced picture
    Photo credit: PeopleImages/iStock via Getty ImagesWhat kids are doing on tablets seems to matter more than how long they use them.

    Concerns surrounding young people’s screen time are widespread.

    Australia became the first country to ban social media for users under 16 in December 2025, and DenmarkFrance and the U.K. have since announced similar restrictions to begin this year.

    In the U.S., as of mid-2026, more than 30 states have passed laws banning or restricting cellphones in K–12 classrooms; in 2023, the U.S. surgeon general issued a formal advisory on social media and children’s and adolescents’ mental health; and bestselling books tell parents that smartphones are “rewiring” their children’s brains.

    These concerns and policies are part of a quickly changing national and international conversation around how young people spend time on screens and its relationship to their overall health and development. My reading of the mounting research on this issue across disciplines is that the popular narrative blaming screens and smartphones for an adolescent mental health crisis runs well ahead of the current evidence.

    I study adolescent digital media use and its influence on social, emotional and academic outcomes. A growing body of research suggests that one-size-fits-all solutions are not the answer and that managing appropriate use of digital media needs to take into account a child’s developmental milestones, how parents and adults around them use media, and the ways kids use it to connect and learn with friends and family.

    Screen time: From monolith to multifaceted

    Wide adoption of digital media and the internet broadened the range of experiences young people could have online. At the same time, the digital age introduced newfound uncertainties. As with the advent of radio, comic books and arcades, adults worried about how children might interact with or be affected by internet use.

    In response, the American Academy of Pediatrics first recommended in 1999 that parents and caregivers keep children under 2 away from screens. In the decades since, professional guidance largely treated children’s media use as a behavior to be mitigated.

    Policies introduced by the academy in 2013 and 2016 continued to advise that school-age kids and adolescents – those ages 5 to 18 – be restricted to no more than two hours of “entertainment” screen time a day. The goal was to curb risks associated with heavy media use, among them disrupted sleep, online safety, cyberbullying and physical inactivity.

    Originally created for young people’s engagement with stationary media that tend to be confined to one room or context – for example, watching television – these hourly limits became outdated with the integration of smartphones and other digital devices into everyday life. Compared with watching television, online media was far more difficult to track and define, and more nuanced in its use.

    Developmentally beneficial activities such as educationsocializing and leisure have come to rely on the internet to extend and maintain face-to-face connections. Remote schooling and social distancing during the COVID-19 pandemic only accelerated this digitization of daily life.

    In my view, adopting strict time limits and restrictions could pose risks to children’s well-beingautonomy and development, for example, by harming adolescent self-esteem.

    The latest guidelines

    In January 2026, the American Academy of Pediatrics retired its decade-old framework that had largely organized its advice around hourly screen limits. The new policy statement on children, adolescents and digital media diverges from this blanket approach. Instead, it suggests parents consider the larger picture in which this media use exists rather than lumping all screen use together.

    Similar to the World Health Organization’s 2019 guidance for children under 5, the American Academy of Pediatrics still advises that parents avoid screen media for children younger than 18 months. This recommendation is largely because extended use by children by themselves can be problematic for many young children, crowding out important developmental milestones.

    Both the World Health Organization and the American Academy of Pediatrics also recommend that when children under 24 months use screens, they should be limited to content and devices that encourage children and caregivers to interact. For ages 2 to 5, screen time – including TV and interactive apps on devices – may be extended to more solo use, provided it’s high-quality digital media designed around learning goals in mathematics and reading. But recreational use should be limited to roughly an hour per day.

    For school-age children and teens, the newest guidance has begun to step away from fixed screen time limits and asks families to weigh online activity in the context of everyday life.

    Doing so recognizes that a child’s digital experiences are shaped by diverse factors rather than the hours spent online. Current guidelines call on caregivers to distinguish among types of media, from television and social media to video games and interacting with artificial intelligence chatbots. They also call for taking into account a child’s individual characteristics, such as their interests and personality, family members’ own use of screens, and the type of content children are spending time on.

    Rethinking screen time

    Moving beyond strict screen time limits includes questioning the kind of digital activities kids and adolescents participate in. Do the activities encourage time spent interacting with others online, which can help young people develop important skills and competencies?

    Scrolling an algorithm-based, auto-playing video feed likely does not equate to the same opportunities as video-chatting with friends, creating digital art or working with teammates in a multiplayer game. Research suggests these different uses relate to development in different ways and can help kids develop varying skill sets pertaining to everyday life and schooling.

    Indeed, a large review of current research found that young people who take part in a range of digital activities, such as browsing the web, online gaming or interacting on social media, show positive associations with social connection, identity exploration, civic participation and learning.

    A woman and two small children look at tablet screen
    Parental involvement in young children’s screen time has developmental benefits. Cultura Creative/Tetra images via Getty Images

    Using these guidelines at home

    The current evidence suggests parents and caregivers are best positioned to be digital instructors. Cutting children off altogether can carry its own risks for social and emotional development. Caregiver mediation of children’s screen time can produce widely different outcomes and effects, depending on whether the guidance is supportive or controlling.

    Considering your own digital media use is the first step: Are family members engaging in problematic or heavy media use that children in the household might emulate? What applications and uses are most common in the family, and what positive or negative effects might they have, depending on the child’s age? How could these digital activities be safely integrated with other everyday experiences to increase their benefit for children? Conversely, what online time might be better spent on face-to-face experiences?

    The American Academy of Pediatrics’ Family Media Plan tool turns these ideas into concrete questions. For example, it recommends working out what each child needs from digital technology, what activities screens might be crowding out, and where their family or household can build in screen-free time. The recommendation is to talk with each child about why they are drawn to particular apps or online activities, what they encounter while browsing, and what might be lost when kids bring phones to gatherings such as mealtimes.

    The debate over young people’s screen time is not going away. But the most up-to-date guidelines, and the growing body of research behind them, make a strong case for a more holistic approach. The guidelines treat digital media as a complex, diverse and evolving environment that children need to learn to navigate in the digital age. The risks and rewards depend, as with any developmental setting, on the child, the content and what online time might be crowding out.

    This article originally appeared on The Conversation. You can read it here.

  • ER doctor and mom sets the record straight for parents of kids with e-bikes and e-scooters
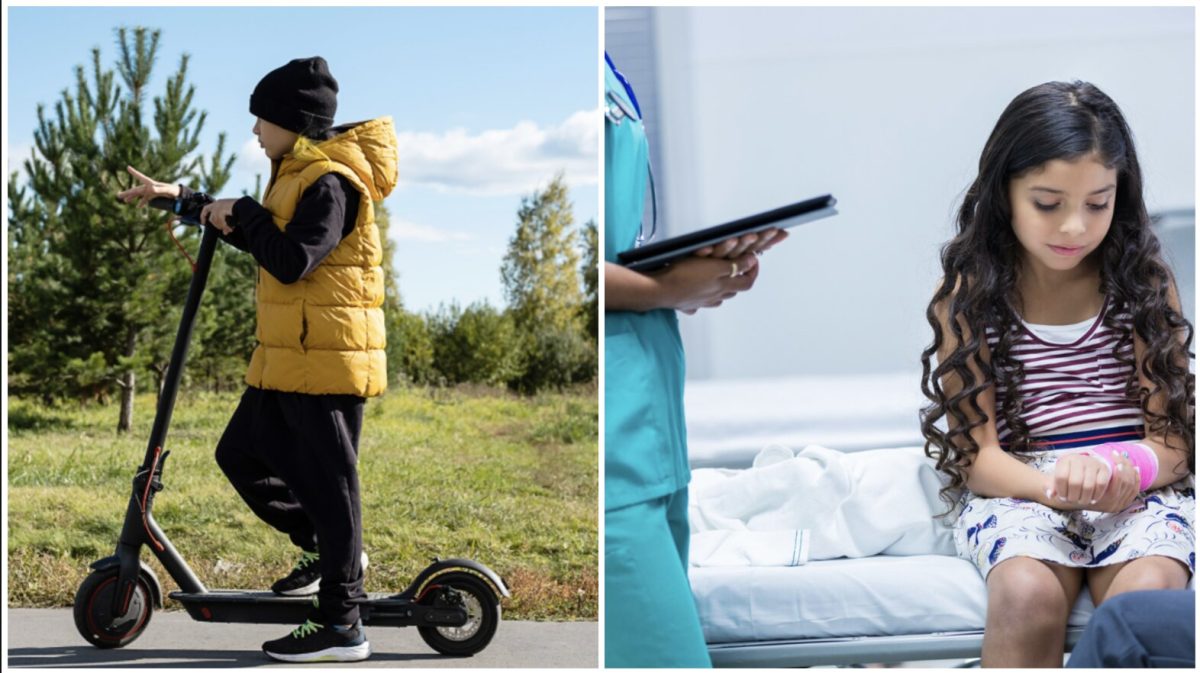
    Photo credit: CanvaA boy rides an e-scooter, left, while a girl is examined in an emergency room.

    An emergency room doctor and fellow mom has been noticing a troubling trend: Many parents are giving their kids something more powerful than bicycles to get around the neighborhood. As a result, she’s seeing more children come into the ER with injuries sustained in e-bike and e-scooter crashes. She recently went online with a plea to parents and young riders.

    Dr. Meghan Elizabeth Beach Martin, known online as Dr. Beachgem, posted a video in her scrubs discussing her concerns after seeing so many children come into the hospital with e-bike injuries during the summer months. She’s worried that too many kids and parents don’t understand the proper safety precautions. As a mother herself, she even questions why children are allowed to ride these devices at all.

    In the video, the doctor explains that some e-bikes can reach speeds of up to 28 mph. She says that if an e-bike goes any faster than that, it’s technically classified as a motorcycle. At those speeds, she regularly sees children with traumatic injuries and broken bones after hitting bumps, cracks in the road, or other vehicles. Many of them aren’t wearing helmets or protective pads, and some are even riding barefoot, making their injuries even more severe. Martin’s video has gained traction on Reddit and elsewhere online.

    E-bikes and e-scooters, examined

    Martin isn’t the only professional seeing a growing problem. The American College of Surgeons reports that there are more than 20,000 e-bike-related injuries each year. Meanwhile, a University of California, San Francisco study found that e-bike injuries doubled annually from 2017 to 2022. The same study found that e-scooter injuries increased by 45% each year during the same period.

    Before riding an e-bike, it’s important to follow proper safety procedures. Make sure you and your child understand your area’s laws regarding e-bikes, including any minimum age requirements. Always wear a helmet and other protective gear when riding. Consider choosing an e-bike with safety features such as motor-interrupt brake levers and disc brakes. These are just a few of the many safety tips experts recommend.

    The U.S. Consumer Product Safety Commission has similar safety tips for e-scooter riders. Wearing a helmet is one of its top recommendations, along with taking other basic precautions. The agency also recommends checking the brakes before riding and slowing down for bumps, cracks, and other road hazards.

    The vast majority of e-scooters and e-bikes are designed for only one rider, so avoid doubling up. Although laws vary by state and locality, wearing more protective gear is always the safer choice. Riders should also review local e-bike and e-scooter laws to make sure they are operating the vehicles safely and legally.

    A little research goes a long way toward making sure you and your children can ride safely. It’s also important for parents to understand that many e-bikes and e-scooters can travel at speeds that make them very different from a traditional bicycle. The last thing you want is for you or your child to become another emergency room statistic.

Explore More Health Stories

Health

Screen time guidelines for kids and adolescents have shifted as research paints a more nuanced picture

Care

ER doctor and mom sets the record straight for parents of kids with e-bikes and e-scooters

Health

May cause joy: The full-spectrum health benefits of dance 

Research

Why we crave company