What’s the most efficient way to get around? Planes might burn a lot of fuel, but they also are filled with people, making each gallon go a lot farther. How does that stack up against trains, buses, cars, or the gasoline equivalent of eating a burger and hopping on your bike? The answer may surprise you. In our latest Transparency, GOOD looks at what form of transportation gets the most bang per gallon on a 350 mile trip.A collaboration between GOOD and Robert A. Di Ieso, Jr.Sources: Amtrak; Calorielab.com; Boeing; U.S. Department of Energy; U.S. Environmental Protection Agency Correction: There was a typo in the original piece, indicating that a motor coach gets .02 gallons per mile, rather than .2 GPM. You can view the uncorrected piece here. A version of this piece appeared on page 64 of GOOD 015: The Transportation Issue.
Tags
advertisement
More for You
-
Man’s dog suddenly becomes protective of his wife, Internet clocks the reason right away
The online community came through in a big way.
Reddit user Girlfriendhatesmefor’s three-year-old pitbull, Otis, had recently become overprotective of his wife. So he asked the online community if they knew what might be wrong with the dog.
“A week or two ago, my wife got some sort of stomach bug,” the Reddit user wrote under the subreddit /r/dogs. “She was really nauseous and ill for about a week. Otis is very in tune with her emotions (we once got in a fight and she was upset, I swear he was staring daggers at me lol) and during this time didn’t even want to leave her to go on walks. We thought it was adorable!”
His wife soon felt better, butthe dog’s behavior didn’t change.
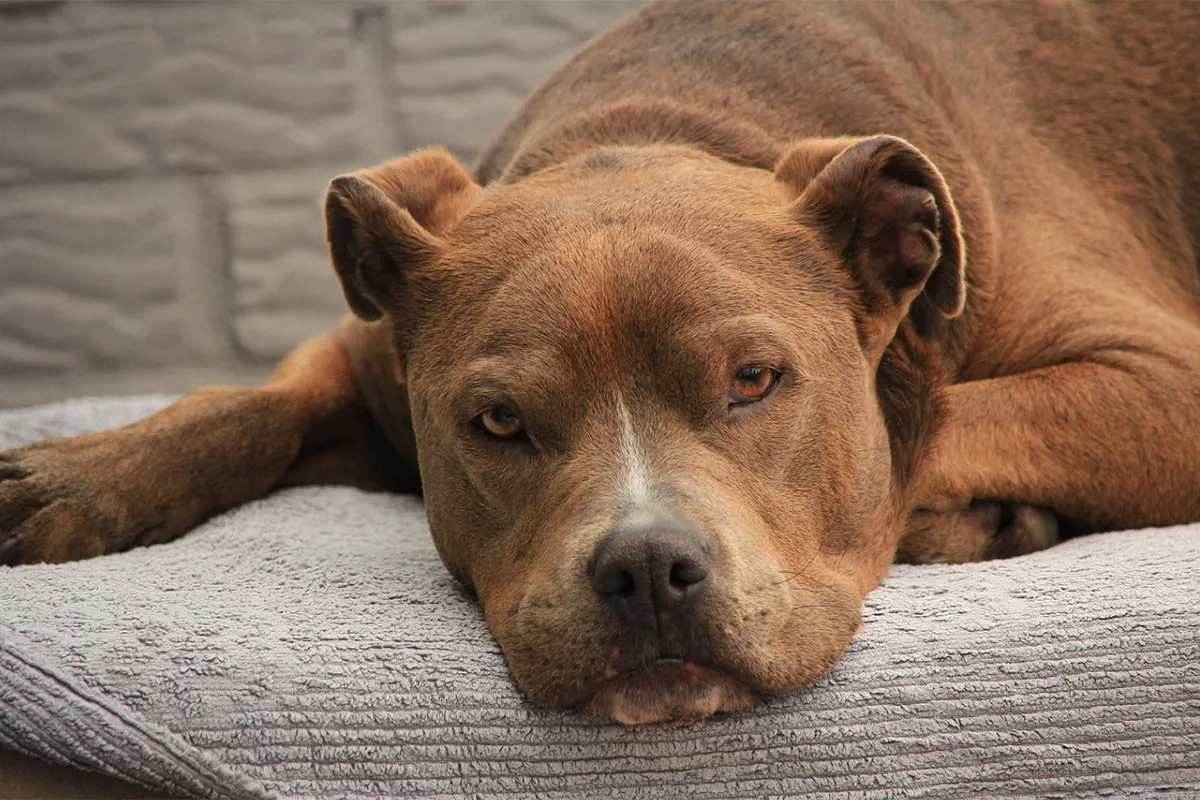
Otis knew before they did. Canva Girlfriendhatesmefor began to fear that Otis’ behavior may be an early sign of an aggression issue or an indication that the dog was hurt or sick.
So he threw a question out to fellow Reddit users: “Has anyone else’s dog suddenly developed attachment/aggression issues? Any and all advice appreciated, even if it’s that we’re being paranoid!”
The most popular response to his thread was by ZZBC.
Any chance your wife is pregnant?
ZZBC | Reddit
The potential news hit Girlfriendhatesmefor like a ton of bricks. A few days later, Girlfriendhatesmefor posted an update and ZZBC was right!
“The wifey is pregnant!” the father-to-be wrote. “Otis is still being overprotective but it all makes sense now! Thanks for all the advice and kind words! Sorry for the delayed reply, I didn’t check back until just now!”
Redditors responded with similar experiences.
Anecdotal I know but I swear my dog knew I was pregnant before I was. He was super clingy (more than normal) and was always resting his head on my belly.
realityisworse | Reddit
So why do dogs get overprotective when someone is pregnant?
Jeff Werber, PhD, president and chief veterinarian of the Century Veterinary Group in Los Angeles, told Health.com that “dogs can also smell the hormonal changes going on in a woman’s body at that time.” He added the dog may “not understand that this new scent of your skin and breath is caused by a developing baby, but they will know that something is different with you—which might cause them to be more curious or attentive.”
The big lesson here is to listen to your pets and to ask questions when their behavior abruptly changes. They may be trying to tell you something, and the news may be life-changing.
This article originally appeared last year.
-
Chris Hemsworth is the 35-year-old star of “Thor: Ragnarok,” or you may know him as the brother of equally attractive actor Liam Hemsworth. But did you know he’s also a father-of-three? Well, he is. And it turns out, he’s pretty much the coolest dad ever.
-
14 images of badass women who destroyed stereotypes and inspired future generations
These trailblazers redefined what a woman could be.
Throughout history, women have stood up and fought to break down barriers imposed on them from stereotypes and societal expectations. The trailblazers in these photos made history and redefined what a woman could be. In doing so, they paved the way for future generations to stand up and continue to fight for equality.


advertisement

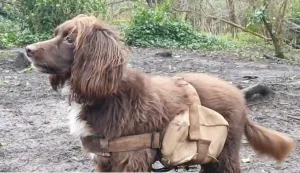
Wildlife reserves and gardens alike can be regrown thanks to dogs wearing backpacks with seeds

How the ‘fog harvesting’ women of Morocco are influencing how desert areas get drinking water


Sign Up for the Daily Good!
Advertisement