It is said that hospitality is not just about serving food to customers but also serving souls. However, if the customer starts displaying utterly rude behavior, they have to be put in their place. In August 2023, a Reddit user shared a story about their friend who encountered a customer like that in r/pettyrevenge. The man presented the server with a $100 tip that they discovered later, was fake. They were furious but they did something that left the customer dumb-mouthed. They were lauded by people for how they handled the situation.

The server in question received an irate customer one day. The man was one of the regular customers, usually remained quiet, and didn’t tip well. Most of the time, he visited the restaurant with his friends or by himself, where he would sit in the bar and watch a sports game. “I’ve never had a problem with him until he came in one time with a date,” the server wrote.

petty revenge, restaurant server, viral Reddit, tipping culture
Representative Image: Money changing hands. Canva

That specific day, a woman was accompanying the man. The server had never seen the woman before so they assumed the man was on a date. After their meal, the couple called the server and asked them for the check. They went right around the corner from the table to get it.

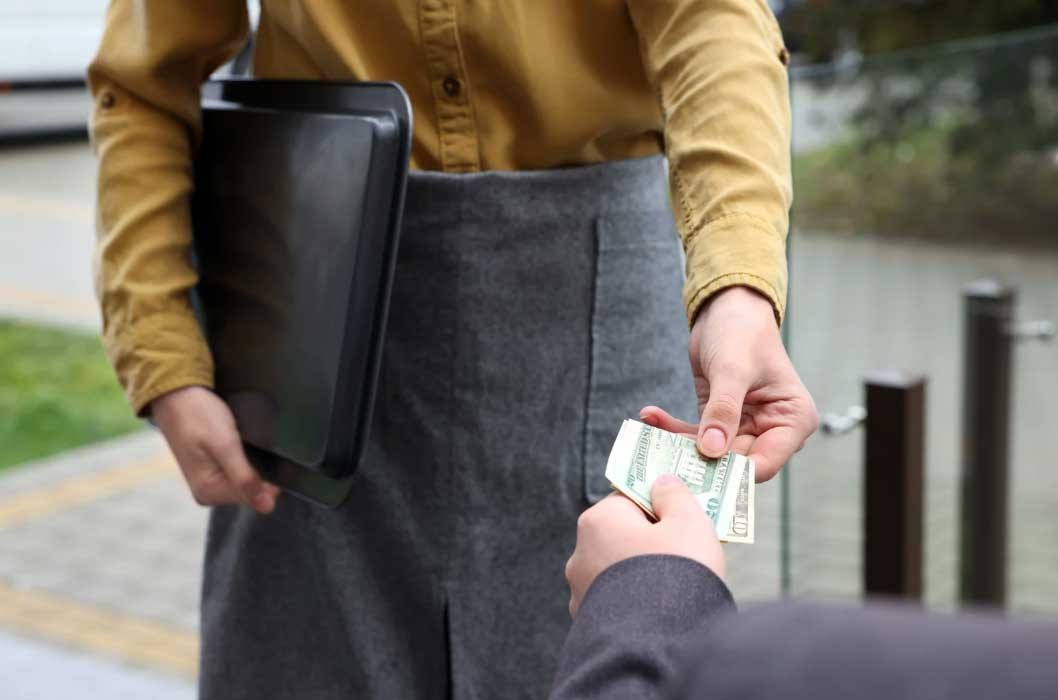
As they were returning to the table, they noticed that the man was placing a $100 bill on the table. “The guy says to the woman, ‘Watch this’ as he puts down a hundred dollar bill on the table. He saw me see and he was joking like, ‘Oh! you weren’t supposed to see that’,” they wrote. He was probably trying to impress the woman, the server thought. But they didn’t care about it as they needed money at that time and their focus was on the $100 tip.

server story, dating red flag, customer service, hospitality fail
Representative Image: It seemed like a great tip at first. Canva

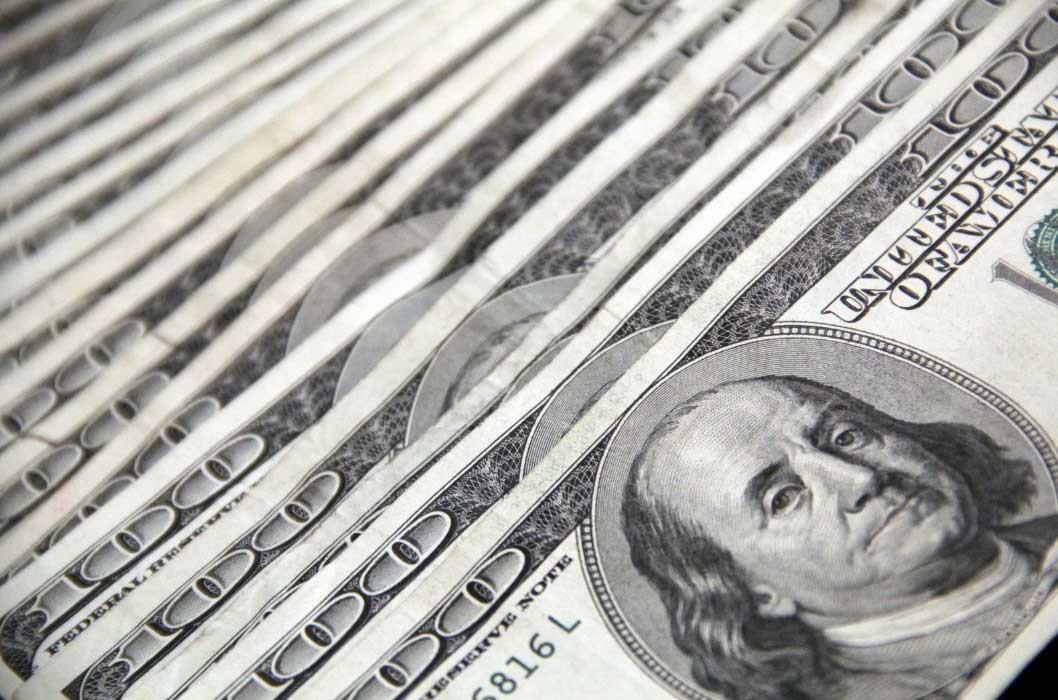
To their shock, they discovered that the $100 note was fake. “That means this freaking guy planned this out to impress this woman. It was so frustrating because I needed the money but at the same time I thought it was because I did a great job,” the waiter said. They narrated the entire incident to her manager who thought it was “ridiculous.”

Two weeks later, the obnoxious man visited the restaurant again with the same woman. This time, the server was working on different tables and was quite busy. But when their manager asked if they wanted to take the order for the couple’s table and teach the man a lesson, they said yes. It was their chance to settle the score with the man. They walked to their table, with the fake $100 note in their pocket, waiting for the right moment to act. “I get to their table and they instantly recognize me, the woman seemed normal but the guy looked like he was nervous. I pretended nothing happened all the way until I got their check,” the server described.

via GIPHY

When they brought the check, they placed it down on the table along with the fake $100 bill, saying, “Hey, not sure if you remember me from last time but I believe you forgot this, just returning it because I believed it was too much.” Apparently, their trick worked. The woman on the table looked confused as if she had spotted the man’s deception. The server walked away. When they returned, they found a big $0.00 from the man as their tip on the signed copy. But on a positive note, the woman who was also sitting at the same table and saw the whole charade of her date, left a $50 tip for the server.

“One can only assume that the guy didn’t want to tip on his card so he wrote obnoxiously big zeros on the tip and that $50 just happened to be where the woman was sitting, so I’m hoping she had placed it there,” the server reflected, adding that they hoped the woman eventually saw the red flags that the man showed.

The server’s story was upvoted by 15,000 people and over 730 left comments on it. u/tricularia commented, “My dad always told me that if you want to know how someone will act in a long-term relationship, pay attention to how they treat servers in restaurants. And since I started paying attention, I am definitely noticing a pattern there.”

Image Source: Reddit | u/eloagent

u/Its_only__forever shared their own similar experience, “As someone that has been in the industry for over 2 decades, I love this. I had a party once that tipped me in pennies spread across the table when they left. I scooped that s**t up so fast and chased them out and just dumped it at their feet with an ‘I think you forgot something.’ Yes, I got in trouble. Yes, it was worth it.”

Image Source: Reddit | u/spoomplesplz

Many said the woman needed to know that the man was a liar. “This is fabulous! I hope the lady dumped him because you showed her what kind of jerk he was,” said u/assignmentfit461. u/thekeekses added, “As a woman who was raised by a single mother who was a server for many many years, I ended a relationship with a guy because he didn’t tip.”

Image Source: Reddit | u/mulderitsme99

u/Careless_Candle6771 shared from her personal experience. “The place I work at is a hot spot for 1st dates and any time I cash a couple out, I ask them if they want their receipt. The dude usually says no as the merchant copy is being printed and then I can see the $0 tip and I go, “ok!” And then just leave it face up on the table anyway. My god, do I love when the women run back with cash saying, “Oh, my god I’m so sorry!”

via GIPHY

This article originally appeared last year.

  • The salary you need to live comfortably in 100 US cities
    A view of the San Antonio River walkway in San Antonio, Texas.
    ,

    The salary you need to live comfortably in 100 US cities

    Big-city comfort comes with a six-figure price tag.

    Jaclyn DeJohn, CFP for SmartAsset

    To truly understand the context of a household’s income, it must be compared to local costs and long-term goals, which both may fluctuate over time. For most people, the same pillars will make up the biggest nonnegotiables in their budget. These include basic necessities like housing, groceries, utilities, and transportation, and likely some discretionary spending on hobbies, activities, and other enrichment. In an attempt to secure this lifestyle for the future, many households aim to save some of their income for emergencies, investments, retirement, education, and other long-term goals. A common budgeting technique that encapsulates these three pillars is called the 50/30/20 rule: 50% of your post-tax income goes to needs, 30% to your wants, and 20% gets set aside for the future.

    With this in mind, SmartAsset assessed the salary needed to reach this 50/30/20 ideal — designated as a comfortable salary — based on the local costs in 100 of the largest U.S. cities.

    Key Findings

    • A single adult needs to earn $150,000 to live comfortably in these places. New York has the highest individual salary needed to live comfortably at $158,954. San Jose, California, follows closely at $158,080. Orange County cities Irvine, Anaheim, and Santa Ana require an estimated $151,965 in income for a single adult.
    • These cities have the lowest salary needed to live comfortably. San Antonio has the lowest salary threshold for both single adults and families of four at $83,242 and $192,608, respectively. New Orleans has the second-lowest salary needed for a single adult to live comfortably at $84,406, followed by Memphis, Tennessee, at $86,320.
    • The Bay Area is the most expensive place for a family to live comfortably. Bay Area cities make up the top four of the five places with the highest salary needed for a family of four to live comfortably. Incomes across two parents are projected at $407,597 in San Francisco, $402,771 in San Jose, and $371,488 in both Fremont and Oakland. Boston rounds out the top five at $368,742.
    • Families in these Texas cities are closest to a comfortable salary. In Frisco, the median household earns $145,444 — substantially higher than the national median of $83,730. This figure also accounts for 63.1% of the $230,464 income a family of four in Frisco needs to live comfortably. In McKinney, the $124,177 median household income accounts for 53.9% of the $230,464 needed.
    Table listing the top cities by the lowest annual salary needed for a single adult to live in sustainable comfort using the 50/30/20 budgeting rule.

    10 Cities With the Highest Salary Needed to Live Comfortably

    1. New York, New York

    • Salary needed for a single adult: $158,954
    • Salary needed for a working family of four: $337,875
    • Median household income: $81,228

    2. San Jose, California

    • Salary needed for a single adult: $158,080
    • Salary needed for a working family of four: $402,771
    • Median household income: $148,226

    3. (tie) Irvine, California

    • Salary needed for a single adult: $151,965
    • Salary needed for a working family of four: $327,226
    • Median household income: $145,731

    3. (tie) Anaheim, California

    • Salary needed for a single adult: $151,965
    • Salary needed for a working family of four: $327,226
    • Median household income: $101,145

    3. (tie) Santa Ana, California

    • Salary needed for a single adult: $151,965
    • Salary needed for a working family of four: $327,226
    • Median household income: $95,118

    6. Boston, Massachusetts

    • Salary needed for a single adult: $139,776
    • Salary needed for a working family of four: $368,742
    • Median household income: $97,791

    7. (tie) San Diego, California

    • Salary needed for a single adult: $136,781
    • Salary needed for a working family of four: $312,915
    • Median household income: $111,032

    7. (tie) Chula Vista, California

    • Salary needed for a single adult: $136,781
    • Salary needed for a working family of four: $312,915
    • Median household income: $105,101

    9. San Francisco, California

    • Salary needed for a single adult: $134,950
    • Salary needed for a working family of four: $407,597
    • Median household income: $139,801

    10. (tie) Fremont, California

    • Salary needed for a single adult: $134,410
    • Salary needed for a working family of four: $371,488
    • Median household income: $175,816

    10. (tie) Oakland, California

    • Salary needed for a single adult: $134,410
    • Salary needed for a working family of four: $371,488
    • Median household income: $102,235

    10 Cities With the Lowest Salary Needed to Live Comfortably

    1. San Antonio, Texas
    • Salary needed for a single adult: $83,242
    • Salary needed for a working family of four: $192,608
    • Median household income: $66,176
    1. New Orleans, Louisiana
    • Salary needed for a single adult: $84,406
    • Salary needed for a working family of four: $197,766
    • Median household income: $58,821
    1. Memphis, Tennessee
    • Salary needed for a single adult: $86,320
    • Salary needed for a working family of four: $193,939
    • Median household income: $52,679
    1. Oklahoma City, Oklahoma
    • Salary needed for a single adult: $86,861
    • Salary needed for a working family of four: $213,325
    • Median household income: $70,040
    1. Baltimore, Maryland
    • Salary needed for a single adult: $87,485
    • Salary needed for a working family of four: $224,224
    • Median household income: $64,778
    1. Louisville, Kentucky
    • Salary needed for a single adult: $88,234
    • Salary needed for a working family of four: $212,742
    • Median household income: $67,251
    1. Tulsa, Oklahoma
    • Salary needed for a single adult: $88,317
    • Salary needed for a working family of four: $215,238
    • Median household income: $60,930
    1. Winston-Salem, North Carolina
    • Salary needed for a single adult: $88,442
    • Salary needed for a working family of four: $205,421
    • Median household income: $57,758
    1. Tucson, Arizona
    • Salary needed for a single adult: $88,899
    • Salary needed for a working family of four: $218,400
    • Median household income: $60,483
    1. Fort Wayne, Indiana
    • Salary needed for a single adult: $88,982
    • Salary needed for a working family of four: $233,126
    • Median household income: $61,436

    Data and Methodology

    SmartAsset used MIT Living Wage Calculator data to gather the basic cost of living for an individual with no children and for two working adults with two children. Data includes the cost of necessities, including housing, food, transportation, and income taxes. It was last updated to reflect the most recent data available on Feb. 15, 2026.

    Applying these costs to the 50/30/20 budget for 100 of the largest U.S. cities, MIT’s living wage is assumed to cover needs (i.e., 50% of one’s budget). From there, the total annual wage was extrapolated for individuals and families to spend 30% of the total on wants and 20% on savings or debt payments. Median household income data for cities comes from the U.S. Census Bureau’s 1 Year American Community Survey for 2024.

    This story was produced by SmartAsset and reviewed and distributed by Stacker.

  • 8 ways to squeeze more miles from every tank, according to America’s fleet pros
    Man inflating car tires at a gas station.

    Kelly Soderlund for Samsara

    The trucking industry has turned fuel efficiency into a science. Here’s what everyday drivers can borrow from their playbook.

    Diesel hit $5.03 per gallon for U.S. commercial fleets in early 2026 — and fuel already eats up roughly 21–24% of what motor carriers spend just to operate. That financial pressure turned fuel management into one of the most carefully engineered problems in the trucking industry. Fleet operators have cameras, sensors, and software all pointed at one question: How do you stop wasting fuel?

    The answers they’ve landed on aren’t mysterious or trucking-specific. Most of them apply just as well to a Honda Civic as to an 18-wheeler. Samsara shares eight things the pros do that you can start doing today.

    1. Stop idling. Seriously.

    This one sounds obvious until you add up how often you actually do it. Sitting in a drive-through, waiting for someone outside a building, letting the car “warm up” before a winter drive — it all adds up. Commercial trucks burn close to a gallon of fuel per hour while idling, and the widely held belief that idling is easier on an engine than restarting is flat-out wrong. Restarting costs less.

    Fleet companies track idling per driver and flag anything that looks excessive. At home, the rule of thumb is simple: If you’re stopped for more than a minute and going nowhere, shut it off.

    2. Drive like you’re trying to protect a full cup of coffee on the dashboard.

    The way you use your right foot is probably the single biggest variable in your fuel economy. Hard acceleration, speeding, and aggressive braking can reduce fuel efficiency by as much as 40%, according to the U.S. Department of Energy. That’s nearly half your gas budget.

    Commercial fleets coach their drivers specifically on smooth throttle inputs: gradual acceleration, cruise control on highways, and coasting into stops instead of braking late and hard. The physics don’t care what size vehicle you’re driving.

    3. Pay attention to your own numbers.

    One discovery from the fleet world: When you show drivers their own efficiency scores, they improve without being told to. Companies that introduced driver performance dashboards and friendly competition between drivers saw measurable gains — one fleet tracked a jump from 6 MPG to 7.5 MPG after making individual scores visible.

    Most cars already give you this data. If yours has a fuel economy display, watch it. If you want to go further, note your mileage at each fill-up and calculate your MPG manually. Setting a personal monthly target and trying to beat it month over month is genuinely effective, mostly because awareness changes behavior.

    4. Think like a dispatcher when you plan your errands.

    The cheapest gallon of fuel is the one you never have to buy. Commercial dispatchers obsess over route efficiency because unnecessary miles are pure cost with no upside. That logic applies in your driveway, too.

    Before you run errands, spend 90 seconds thinking about the most logical order — fewest backtracks, least highway-to-city switching, combining stops you’d otherwise make on separate days. Apps like Google Maps and Waze handle the turn-by-turn, but the trip consolidation decision is yours to make before you leave.

    5. Find cheaper gas before you’re running on empty.

    Fuel prices can vary by 30 cents or more per gallon within just a few miles. Fleet operators now route drivers toward lower-cost fuel stops using real-time price data. You can do the exact same thing with GasBuddy, Waze’s gas prices layer, or the gas station search in Google Maps, which pulls in nearby prices.

    The habit that makes this work: Check prices before your tank is low, not after. Desperation-fueling — stopping at whatever’s convenient when the warning light is on — is reliably the most expensive way to fill up.

    6. Watch for fraud at the pump.

    This is less about efficiency and more about not losing money you didn’t know you were losing. Fuel theft and card skimming at gas stations are more common than most drivers realize, and fraudulent charges from a compromised card often go unnoticed for weeks. Fleet companies use real-time transaction alerts to flag unusual purchases immediately.

    For personal use, a few practical habits help: Use tap-to-pay instead of swiping when the terminal allows it (skimming devices can’t read contactless transactions), check your bank and credit card statements weekly, and consider a card with real-time transaction notifications turned on.

    7. Your tire pressure is costing you money right now.

    Here’s a number that tends to surprise people: For every 1 PSI drop in tire pressure, your vehicle loses roughly 0.4% of its fuel efficiency. Tires lose pressure slowly and steadily — a few PSI over a few months is completely normal and easy to miss. By the time you notice a tire looks low, it’s been costing you at the pump for weeks.

    Fleet maintenance teams tie tire pressure checks directly to fuel economy because the correlation is consistent and measurable. For personal vehicles, checking tire pressure once a month takes about five minutes. While you’re at it, a clogged air filter, old engine oil, or worn spark plugs all carry similar slow-drain effects on efficiency that a routine tune-up addresses.

    8. Track your MPG over time — and notice when it changes.

    Fleets benchmark fuel performance across their vehicles and flag outliers: a truck getting meaningfully fewer miles per gallon than similar trucks is likely developing a mechanical problem before it becomes a breakdown. The fuel data is an early warning signal.

    Your car works the same way. If you track your MPG over several fill-ups and see a notable drop without a change in how or where you’re driving, something is usually going on mechanically. Catching it at the “slightly worse MPG” stage is almost always cheaper than catching it at the “broken down on the highway” stage.

    Fuel cost analysis and fleet efficiency data referenced in this article are drawn from Samsara’s research on commercial fleet fuel management.

    This story was produced by Samsara and reviewed and distributed by Stacker.

  • The happiest cities in America in 2026, ranked across 11 factors
    A sunrise view of a row of cherry blossom trees and the Rosslyn skyline reflected in the Tidal Basin in Virginia.
    ,

    The happiest cities in America in 2026, ranked across 11 factors

    Arlington leads a data-driven look at where Americans may be happiest.

    Jaclyn DeJohn, CFP for SmartAsset

    Happiness may not be easy to quantify, but some qualifiers may make a person more likely to feel satisfied in life. A reasonable degree of financial freedom can alleviate worry about day-to-day costs and the occasional unexpected expense. Similarly, good relationships, overall health and longevity, basic conveniences, and privacy can go a long way in keeping stress down and contentment up. While none of these things alone are the secret to happiness, they may all individually contribute to a life geared toward wants rather than needs — freeing up time and resources for individuals to explore and build a life on their own terms.

    With this in mind, SmartAsset ranked 85 of the largest U.S. cities with available data based on 11 happiness factors spanning personal finance, physical and mental well-being, and quality of life factors.

    Key Findings

    • Arlington, VA, ranks as the happiest city for 2026. Arlington ranks among the top five cities for a variety of happiness metrics, including life expectancy (83.9 years), household earnings over $100,000 (64.3%), mentally healthy days (84.9%), adults getting exercise (83%), and access to activity spaces (100%).
    • Fremont, CA, households outearn their peers. Ranking second overall for happiest cities, 70.7% of Fremont households earn over $100,000, the most studywide. This pairs with the lowest poverty rate of 4.7%. However, 18.1% of households in Fremont end up spending 50% or more of their income on housing. In tandem, the population maintains the highest rate of health insurance coverage and marriage, at 98.1% and 63.8%, respectively.
    • Austin, TX, has the least traffic. The traffic volume per meter in Austin, Texas — a practice ground for many autonomous vehicle companies — is lowest studywide at 42.1. This pales in comparison to Boston, which has over 40 times the traffic volume per meter at 1753.9. The average traffic volume per meter is 299.
    • Residents have the most mentally healthy days in Honolulu. Ranking 16th happiest overall, Honolulu residents feel mentally healthy for 85.2% of days. San Jose, California, follows closely at 85% mentally healthy days. On the other end of the spectrum, the residents of Toledo, Ohio, have the worst mental health ranking, at 78.2% of days spent mentally healthy.
    • These California cities have the most overcrowding in housing. Privacy and space can go a long way in making a person comfortable in their own space, and can be indicative of financial resources. In Long Beach, Los Angeles, and Fresno, just over 10% of households are home to more than one person per bedroom. Laredo, Texas, also falls into this category of high overcrowding. Meanwhile, Pittsburgh has the lowest rate of overcrowding at 0.9%.
    Table listing the top cities where Americans are happiest.

    Top 25 Happiest Cities

    1. Arlington, VA
    • Households earning $100k+: 64.3%
    • Poverty rate: 8.3%
    • Households spending >50% of income on housing: 14.2%
    • Poor mental health days: 15.1%
    • Life expectancy (years): 83.9
    • Percent of adults getting exercise: 83%
    • Population with health insurance: 93.9%
    • Marriage rate: 44.2%
    • Traffic volume per meter: 540
    • Access to activity space: 100%
    • Overcrowded households: 3.4%
    1. Fremont, CA
    • Households earning $100k+: 70.7%
    • Poverty rate: 4.7%
    • Households spending >50% of income on housing: 18.1%
    • Poor mental health days: 17.8%
    • Life expectancy (years): 82
    • Percent of adults getting exercise: 81.2%
    • Population with health insurance: 98.1%
    • Marriage rate: 63.8%
    • Traffic volume per meter: 683
    • Access to activity space: 99.6%
    • Overcrowded households: 7.7%
    1. San Jose, CA
    • Households earning $100k+: 64.2%
    • Poverty rate: 8.1%
    • Households spending >50% of income on housing: 15.7%
    • Poor mental health days: 15%
    • Life expectancy (years): 83.8
    • Percent of adults getting exercise: 80.9%
    • Population with health insurance: 95.6%
    • Marriage rate: 48.6%
    • Traffic volume per meter: 626.4
    • Access to activity space: 99.4%
    • Overcrowded households: 7.9%
    1. Seattle, WA
    • Households earning $100k+: 57.1%
    • Poverty rate: 9.4%
    • Households spending >50% of income on housing: 15%
    • Poor mental health days: 16.6%
    • Life expectancy (years): 81.1
    • Percent of adults getting exercise: 86.7%
    • Population with health insurance: 96.3%
    • Marriage rate: 39.5%
    • Traffic volume per meter: 333
    • Access to activity space: 97.9%
    • Overcrowded households: 3.9%
    1. Raleigh, NC
    • Households earning $100k+: 43%
    • Poverty rate: 13.3%
    • Households spending >50% of income on housing: 12%
    • Poor mental health days: 15.7%
    • Life expectancy (years): 81
    • Percent of adults getting exercise: 84.2%
    • Population with health insurance: 92.9%
    • Marriage rate: 38.8%
    • Traffic volume per meter: 111.6
    • Access to activity space: 98.6%
    • Overcrowded households: 2%
    1. Boise, ID
    • Households earning $100k+: 39.9%
    • Poverty rate: 12.9%
    • Households spending >50% of income on housing: 10.9%
    • Poor mental health days: 17.1%
    • Life expectancy (years): 79.7
    • Percent of adults getting exercise: 82.4%
    • Population with health insurance: 93.1%
    • Marriage rate: 44.2%
    • Traffic volume per meter: 116.7
    • Access to activity space: 91.6%
    • Overcrowded households: 1.9%
    1. Lincoln, NE
    • Households earning $100k+: 33.5%
    • Poverty rate: 13.4%
    • Households spending >50% of income on housing: 12.6%
    • Poor mental health days: 15.3%
    • Life expectancy (years): 79.1
    • Percent of adults getting exercise: 78.9%
    • Population with health insurance: 93.4%
    • Marriage rate: 47%
    • Traffic volume per meter: 211.1
    • Access to activity space: 95.4%
    • Overcrowded households: 2.2%
    1. Anchorage, AK
    • Households earning $100k+: 53.9%
    • Poverty rate: 8.3%
    • Households spending >50% of income on housing: 13.2%
    • Poor mental health days: 16.3%
    • Life expectancy (years): 76.3
    • Percent of adults getting exercise: 80.1%
    • Population with health insurance: 90.6%
    • Marriage rate: 48.7%
    • Traffic volume per meter: 152.3
    • Access to activity space: 93.9%
    • Overcrowded households: 4.5%
    1. San Francisco, CA
    • Households earning $100k+: 61%
    • Poverty rate: 11.3%
    • Households spending >50% of income on housing: 16.9%
    • Poor mental health days: 16.6%
    • Life expectancy (years): 82.4
    • Percent of adults getting exercise: 83.6%
    • Population with health insurance: 97.2%
    • Marriage rate: 39.1%
    • Traffic volume per meter: 794
    • Access to activity space: 100%
    • Overcrowded households: 6.8%
    1. Minneapolis, MN
    • Households earning $100k+: 40.3%
    • Poverty rate: 15.1%
    • Households spending >50% of income on housing: 13.4%
    • Poor mental health days: 16.1%
    • Life expectancy (years): 79.5
    • Percent of adults getting exercise: 83.3%
    • Population with health insurance: 94.3%
    • Marriage rate: 34%
    • Traffic volume per meter: 304.6
    • Access to activity space: 99.1%
    • Overcrowded households: 2.7%
    1. Colorado Springs, CO
    • Households earning $100k+: 41.6%
    • Poverty rate: 8.8%
    • Households spending >50% of income on housing: 14.4%
    • Poor mental health days: 18.4%
    • Life expectancy (years): 76.2
    • Percent of adults getting exercise: 81.5%
    • Population with health insurance: 91.5%
    • Marriage rate: 52.6%
    • Traffic volume per meter: 140.9
    • Access to activity space: 89.8%
    • Overcrowded households: 2.5%
    1. Aurora, CO
    • Households earning $100k+: 46.4%
    • Poverty rate: 10.7%
    • Households spending >50% of income on housing: 15.6%
    • Poor mental health days: 17.1%
    • Life expectancy (years): 79.1
    • Percent of adults getting exercise: 82.4%
    • Population with health insurance: 85.6%
    • Marriage rate: 44.9%
    • Traffic volume per meter: 215.2
    • Access to activity space: 97.5%
    • Overcrowded households: 3%
    1. Charlotte, NC
    • Households earning $100k+: 43.7%
    • Poverty rate: 11.9%
    • Households spending >50% of income on housing: 14.3%
    • Poor mental health days: 16.3%
    • Life expectancy (years): 78.8
    • Percent of adults getting exercise: 81.1%
    • Population with health insurance: 87.9%
    • Marriage rate: 40.4%
    • Traffic volume per meter: 165.5
    • Access to activity space: 88.7%
    • Overcrowded households: 2.3%
    1. Omaha, NE
    • Households earning $100k+: 35.5%
    • Poverty rate: 14.2%
    • Households spending >50% of income on housing: 13.1%
    • Poor mental health days: 15.9%
    • Life expectancy (years): 77.7
    • Percent of adults getting exercise: 75.7%
    • Population with health insurance: 91.2%
    • Marriage rate: 44.3%
    • Traffic volume per meter: 214.9
    • Access to activity space: 97.4%
    • Overcrowded households: 2.1%
    1. Chula Vista, CA
    • Households earning $100k+: 52%
    • Poverty rate: 9.6%
    • Households spending >50% of income on housing: 20.8%
    • Poor mental health days: 17.3%
    • Life expectancy (years): 80.3
    • Percent of adults getting exercise: 81.7%
    • Population with health insurance: 94.8%
    • Marriage rate: 50.2%
    • Traffic volume per meter: 440.1
    • Access to activity space: 97.5%
    • Overcrowded households: 6.9%
    1. Honolulu, HI
    • Households earning $100k+: 44.5%
    • Poverty rate: 10.5%
    • Households spending >50% of income on housing: 19.4%
    • Poor mental health days: 14.8%
    • Life expectancy (years): 81.7
    • Percent of adults getting exercise: 77.8%
    • Population with health insurance: 96.8%
    • Marriage rate: 45.1%
    • Traffic volume per meter: 536.2
    • Access to activity space: 96.6%
    • Overcrowded households: 8.7%
    1. San Diego, CA
    • Households earning $100k+: 55.3%
    • Poverty rate: 10.4%
    • Households spending >50% of income on housing: 20.8%
    • Poor mental health days: 17.3%
    • Life expectancy (years): 80.3
    • Percent of adults getting exercise: 81.7%
    • Population with health insurance: 94.3%
    • Marriage rate: 43.9%
    • Traffic volume per meter: 440.1
    • Access to activity space: 97.5%
    • Overcrowded households: 6.9%
    1. Lexington, KY
    • Households earning $100k+: 34.2%
    • Poverty rate: 12.1%
    • Households spending >50% of income on housing: 14.7%
    • Poor mental health days: 17.4%
    • Life expectancy (years): 76.7
    • Percent of adults getting exercise: 77.1%
    • Population with health insurance: 91.9%
    • Marriage rate: 42.5%
    • Traffic volume per meter: 163.7
    • Access to activity space: 97.4%
    • Overcrowded households: 2.2%
    1. Mesa, AZ
    • Households earning $100k+: 41.9%
    • Poverty rate: 10.8%
    • Households spending >50% of income on housing: 14.2%
    • Poor mental health days: 18.2%
    • Life expectancy (years): 77.5
    • Percent of adults getting exercise: 78%
    • Population with health insurance: 89%
    • Marriage rate: 48.5%
    • Traffic volume per meter: 244.2
    • Access to activity space: 92.8%
    • Overcrowded households: 4.4%
    1. Pittsburgh, PA
    • Households earning $100k+: 33.2%
    • Poverty rate: 20.1%
    • Households spending >50% of income on housing: 11.9%
    • Poor mental health days: 17.9%
    • Life expectancy (years): 76.9
    • Percent of adults getting exercise: 79%
    • Population with health insurance: 96%
    • Marriage rate: 33.6%
    • Traffic volume per meter: 202.3
    • Access to activity space: 93.3%
    • Overcrowded households: 0.9%
    1. Denver, CO
    • Households earning $100k+: 46.8%
    • Poverty rate: 12.1%
    • Households spending >50% of income on housing: 16.3%
    • Poor mental health days: 18.3%
    • Life expectancy (years): 77.4
    • Percent of adults getting exercise: 78.8%
    • Population with health insurance: 90.7%
    • Marriage rate: 40.5%
    • Traffic volume per meter: 415.7
    • Access to activity space: 99.1%
    • Overcrowded households: 3.1%
    1. Oakland, CA
    • Households earning $100k+: 51.2%
    • Poverty rate: 11.9%
    • Households spending >50% of income on housing: 18.1%
    • Poor mental health days: 17.8%
    • Life expectancy (years): 82
    • Percent of adults getting exercise: 81.2%
    • Population with health insurance: 94.1%
    • Marriage rate: 38.3%
    • Traffic volume per meter: 683
    • Access to activity space: 99.6%
    • Overcrowded households: 7.7%
    1. Spokane, WA
    • Households earning $100k+: 38.4%
    • Poverty rate: 12.7%
    • Households spending >50% of income on housing: 13.9%
    • Poor mental health days: 19.9%
    • Life expectancy (years): 76.9
    • Percent of adults getting exercise: 79.6%
    • Population with health insurance: 93.7%
    • Marriage rate: 41.9%
    • Traffic volume per meter: 150.4
    • Access to activity space: 87.6%
    • Overcrowded households: 2.1%
    1. Atlanta, GA
    • Households earning $100k+: 45.4%
    • Poverty rate: 15.8%
    • Households spending >50% of income on housing: 17.3%
    • Poor mental health days: 15.9%
    • Life expectancy (years): 77.5
    • Percent of adults getting exercise: 80%
    • Population with health insurance: 91.4%
    • Marriage rate: 31.8%
    • Traffic volume per meter: 384
    • Access to activity space: 93.8%
    • Overcrowded households: 2%
    1. Henderson, NV
    • Households earning $100k+: 48.3%
    • Poverty rate: 8.8%
    • Households spending >50% of income on housing: 18.5%
    • Poor mental health days: 18.4%
    • Life expectancy (years): 76.6
    • Percent of adults getting exercise: 73%
    • Population with health insurance: 94.2%
    • Marriage rate: 48%
    • Traffic volume per meter: 196.6
    • Access to activity space: 95.7%
    • Overcrowded households: 4.4%

    Data and Methodology

    Eighty-five of the largest U.S. cities for which data was available were evaluated across three categories: personal finance, well-being, and quality of life. Data comes from the U.S. Census Bureau 1-Year American Community Survey for 2024 and the County Health Rankings & Roadmaps for 2025.

    Personal finance metrics included:

    • Percent of individuals earning $100,000 or more.
    • Percent of households that spend 50% or more of their income on housing.
    • Percent of residents below the poverty level.

    Well-being metrics include:

    • Average percentage of days spent with poor mental health
    • Life expectancy in years.
    • Percentage of residents getting exercise.
    • Percentage of residents who have health insurance.

    Quality of life metrics include:

    • Marriage rate.
    • Average traffic volume per meter of major roadways in the county.
    • Percentage of population with adequate access to locations for physical activity.
    • Percentage of households with overcrowding, defined as more than one person living in a room.

    This story was produced by SmartAsset and reviewed and distributed by Stacker.

Explore More Money Stories

Smart Spending

8 ways to squeeze more miles from every tank, according to America’s fleet pros

Everyday Economics

The happiest cities in America in 2026, ranked across 11 factors

Money

Bank of America foreclosed on a couple’s home by mistake. So they got a court order and showed up to foreclose on the bank.

Money

A millionaire swapped lives with a struggling family for a week on a $230 budget. The money wasn’t what broke him.