Teachers strive to care for their students, often stretching beyond the classrooms. Each teacher has their own way of giving to students but it’s no secret that kids love a pizza party more than anything. These parties usually look like lots of games and fun activities while students snack on pizza slices, chips, candies, cookies, and soda. These pizza parties often end up becoming core memories for kids. A person recently criticized school pizza parties stating that most kids often got just one slice of pizza and a small one at that. X user @dondadaNYC highlighted a key issue with blindly criticizing the pizza parties, pointing out that these small pizza parties often came from the teacher’s pocket.

Representative Image Source: Getty Images | Oksix

“Now that I’m older and I realized that they most likely paid for this out of pocket, this made me appreciate teachers more as they are criminally underpaid,” the user wrote in the tweet. This tweet is a response to another tweet by @sznixix, which has been viewed by over 28 million people. In the first tweet, @sznixix ranted about the skimpy meals that teachers usually gave at school pizza parties. “Remember when teachers hype you up about the pizza party to give you this,” they wrote while sharing the pictures of a small pizza slice and a glass of iced cola drink.


Thousands of people flocked in to support @dondadaNYC, agreeing to the fact that teachers in America are so undervalued and underpaid. While some students may remember the small amount of food their teacher got for them at a school pizza party, others appreciate it as a free treat. “This was the gourmet meal we all looked forward to back in the day,” wrote @ivankapeach.


via GIPHY


Other people in the comments section affirmed the reality that most of these pizza parties are organized from the teacher’s pocket, and not from the school’s funds. “My mum is a teacher, she spends a lot of her own money for her kids,” commented @iamunmiyaawan. @dokwhart said, “They 100% paid for it all with their own money after buying extra pencils, erasers, notebooks, and markers that weren’t provided for them. Teachers deserve better.”


Many teachers also came forward to share their experiences hosting pizza parties at their schools. @tap3000 said, “My students think I am ‘rich’ because I legit give them a pizza party from Papa John’s and purchase chips and donuts for them to choose from as an incident and reward. Yes, teachers do pay for room decor and everything out of pocket while they make less than six figures. Teachers are out here making poverty wages and still purchasing things for their students. Most teachers genuinely have good hearts and are good people.”


A teacher, @frookiefr, said “Costco pizza is a lifesaver for my kids’ parties,” adding that sometimes they ask students’ parents for donations for these parties. @themikehawke added that they too got their students to contribute money for the pizza party. @wootsiefootsie suggested an idea, “Want a service where I can donate to schools to throw pizza parties.”

Representative Image Source: Getty Images | Arxont

Given their factual and realistic response, this tweet became viral with over 17 million views in less than a week. It was also shared by u/mook69 in Reddit’s infamous community r/mademesmile where it bagged over 64,000 upvotes and hundreds of comments. Here too, people said that the amount of treats or the size of pizza slices doesn’t matter as much as the teacher spent her money to reward students with the treats. The simple response made many people appreciate what their teachers did for them.

Image Source: Reddit | u/emily_queann

u/oliviaboeyinkxx commented, “And the funds for the pizza party were taken directly from the teachers’ own money. The schools never covered the costs for any of that.” u/wildaloofrebel1010, whose mom is a teacher for 21 years, said, “She has a pizza party at the end of every year. I can confirm, she pays out of pocket for all of her students.” Talking about the original post, u/noobyscientific said, “If you complain about things given to you for free, you shouldn’t get free things.” u/alice_glow had the same message, “You either die a student complaining about the pizza, or live long enough to become an adult who understands the teacher’s budget.”


Image Source: Reddit | u/joyful_alice
  • What a roommate can save you in 100 US cities: 2026 study
    Two persons petting a cat while unpacking boxes in their new room.

    Jaclyn DeJohn, CFP for SmartAsset

    What a roommate can save you in 100 US cities: 2026 study

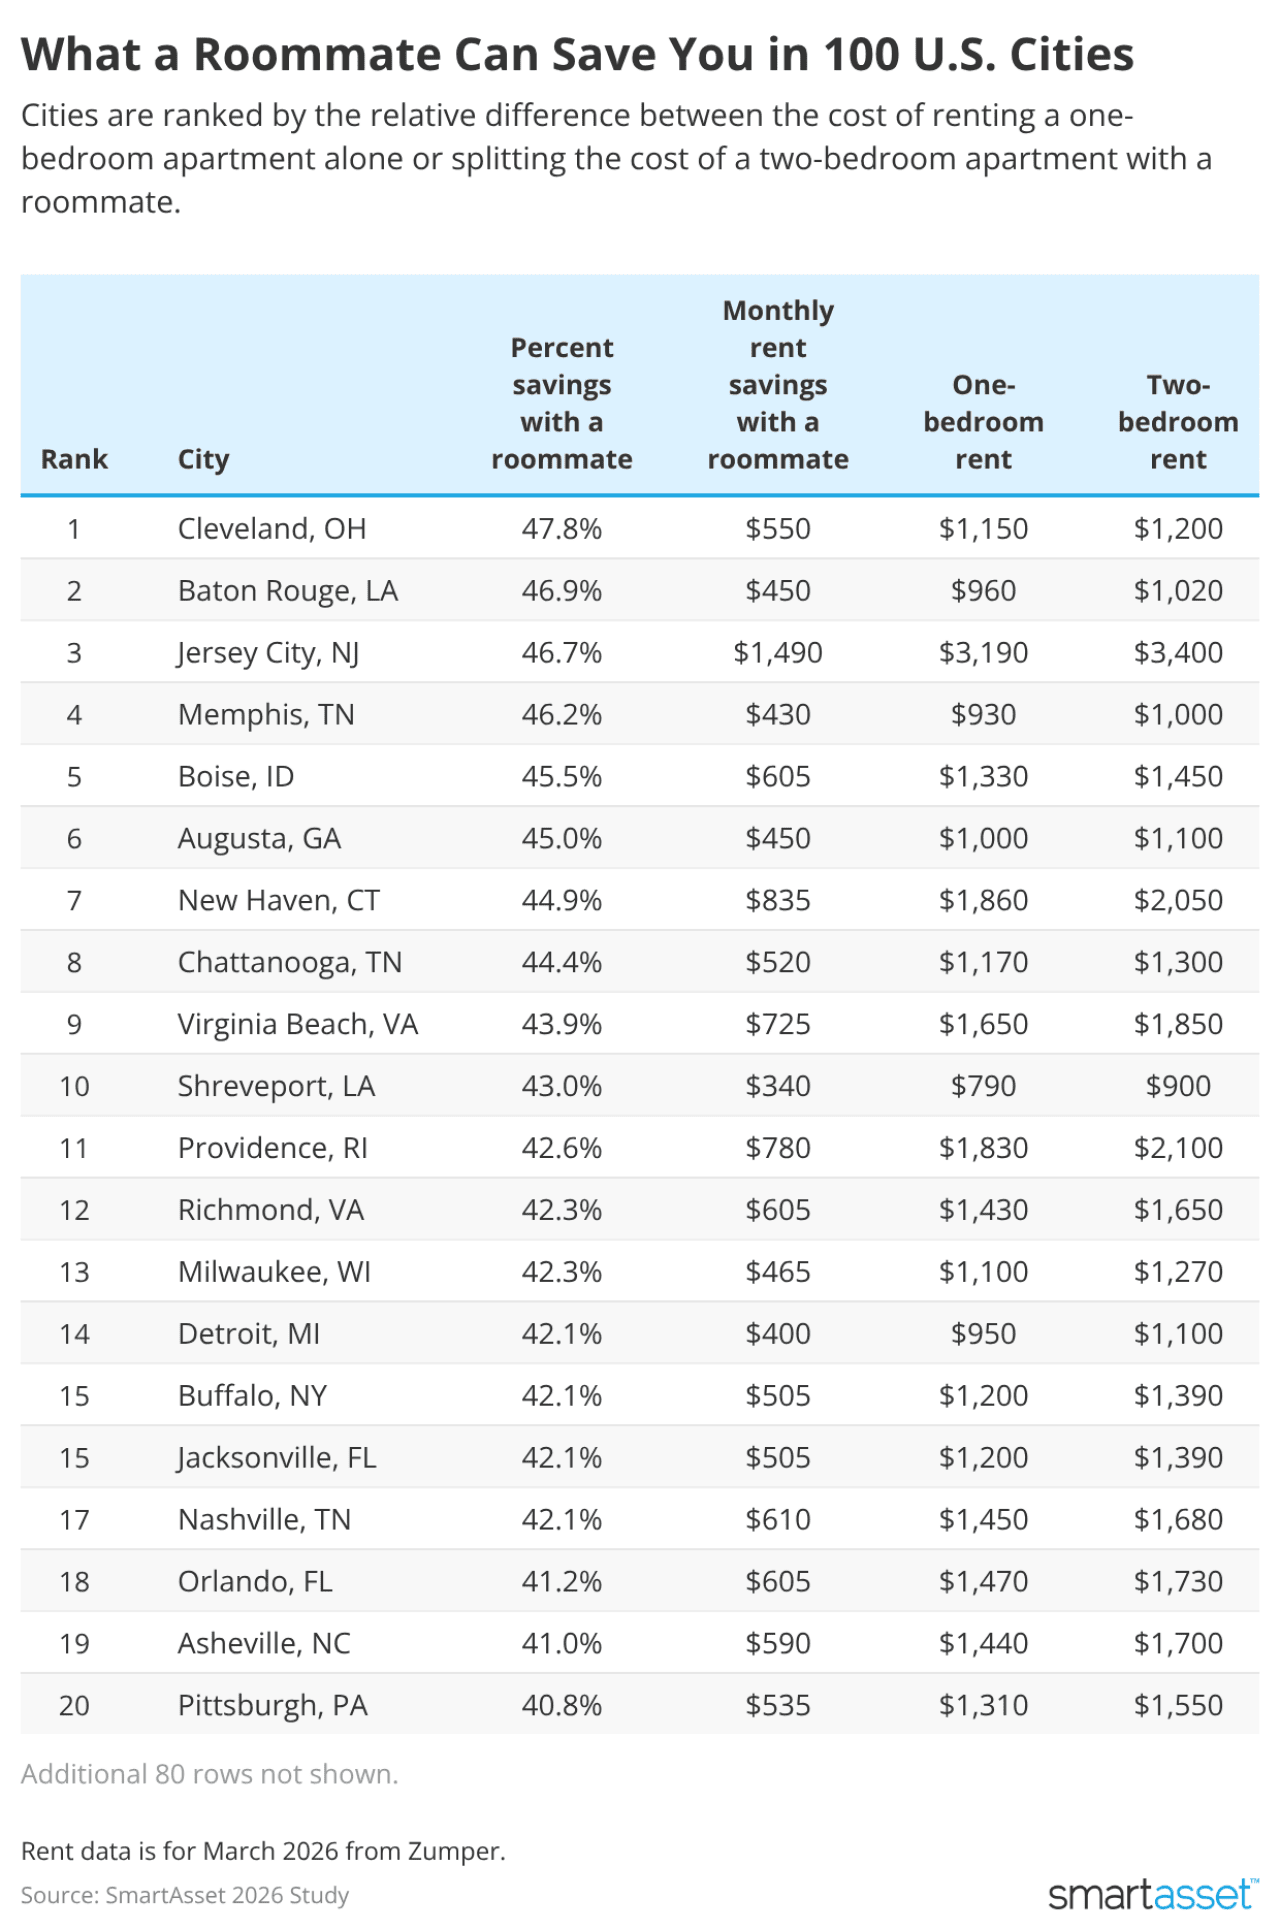
    New college grads, transplants from other cities, and others might find myriad advantages in including a roommate in their housing plan — one of those being cost savings. Particularly in high cost-of-living areas, an extra cushion in the budget could make a big difference in discretionary spending, paying off debt, or investing for the future. Across large U.S. cities, splitting a two-bedroom apartment with a roommate versus living alone in a one-bedroom apartment could save the average renter about $541 per month, or nearly $6,500 per year. In many cities, the average savings climb much higher.

    With this in mind, SmartAsset ranked 100 of the largest U.S. cities based on the percentage of monthly rent saved by sharing an apartment with a roommate.

    Key Findings

    • Adding a roommate gets you the best value in Cleveland, Ohio. Splitting a two-bedroom with another person saves you nearly 48% compared to renting a one-bedroom alone. The average cost of one-bedroom rent in Cleveland currently sits at $1,150, nearly identical to the average two-bedroom rent of $1,200.
    • The average rent for a two-bedroom apartment is only $900 in this city. Shreveport, Louisiana, has the lowest two-bedroom rent out of 100 large cities. With an average one-bedroom price of $790, it ranks 10th overall with a savings of 43% with a roommate, or $340 rent savings per person per month.
    • In NYC, a roommate saves you $1,730 per month. The average one-bedroom rent in New York City is $4,380, while two roommates could split the average $5,300 two-bedroom rent for $2,650 each. Neighboring Jersey City, New Jersey has the second-highest raw monthly dollars saved with a roommate at $1,490 — or 46.7% savings over living alone.
    • A roommate saves you the least in the cities. Relative to local housing costs, sharing your space is least cost effective in Scottsdale, Arizona, where splitting a two-bedroom nets you a 26.0% discount, or a $440 monthly discount. Seattle (28.2% savings; $550 per month) and El Paso, Texas (29.4% savings; $250 per month), also are most budget-friendly to singletons.
    A table ranking U.S. cities based on the saving benefits of having a roommate.

    Top 10 Cities With the Most Savings With a Roommate

    Cities are ranked based on the percent saved in rent between splitting the average two-bedroom apartment with a roommate and living in a one-bedroom apartment alone.

    1. Cleveland, OH
    • Percent savings with a roommate: 47.83%
    • Monthly rent savings with a roommate: $550
    • One-bedroom rent: $1,150
    • Two-bedroom rent: $1,200
    1. Baton Rouge, LA
    • Percent savings with a roommate: 46.88%
    • Monthly rent savings with a roommate: $450
    • One-bedroom rent: $960
    • Two-bedroom rent: $1,020
    1. Jersey City, NJ
    • Percent savings with a roommate: 46.71%
    • Monthly rent savings with a roommate: $1,490
    • One-bedroom rent: $3,190
    • Two-bedroom rent: $3,400
    1. Memphis, TN
    • Percent savings with a roommate: 46.24%
    • Monthly rent savings with a roommate: $430
    • One-bedroom rent: $930
    • Two-bedroom rent: $1,000
    1. Boise, ID
    • Percent savings with a roommate: 45.49%
    • Monthly rent savings with a roommate: $605
    • One-bedroom rent: $1,330
    • Two-bedroom rent: $1,450
    1. Augusta, GA
    • Percent savings with a roommate: 45.00%
    • Monthly rent savings with a roommate: $450
    • One-bedroom rent: $1,000
    • Two-bedroom rent: $1,100
    1. New Haven, CT
    • Percent savings with a roommate: 44.89%
    • Monthly rent savings with a roommate: $835
    • One-bedroom rent: $1,860
    • Two-bedroom rent: $2,050
    1. Chattanooga, TN
    • Percent savings with a roommate: 44.44%
    • Monthly rent savings with a roommate: $520
    • One-bedroom rent: $1,170
    • Two-bedroom rent: $1,300
    1. Virginia Beach, VA
    • Percent savings with a roommate: 43.94%
    • Monthly rent savings with a roommate: $725
    • One-bedroom rent: $1,650
    • Two-bedroom rent: $1,850
    1. Shreveport, LA
    • Percent savings with a roommate: 43.04%
    • Monthly rent savings with a roommate: $340
    • One-bedroom rent: $790
    • Two-bedroom rent: $900

    Top 10 Cities Where It’s Most Cost Effective to Live Alone

    Cities are ranked based on the percent saved in rent between splitting the average two-bedroom apartment with a roommate and living in a one-bedroom apartment alone.

    1. Scottsdale, AZ
    • Percent savings with a roommate: 26.04%
    • Monthly rent savings with a roommate: $440
    • One-bedroom rent: $1,690
    • Two-bedroom rent: $2,500
    1. Seattle, WA
    • Percent savings with a roommate: 28.21%
    • Monthly rent savings with a roommate: $550
    • One-bedroom rent: $1,950
    • Two-bedroom rent: $2,800
    1. El Paso, TX
    • Percent savings with a roommate: 29.41%
    • Monthly rent savings with a roommate: $250
    • One-bedroom rent: $850
    • Two-bedroom rent: $1,200
    1. Albuquerque, NM
    • Percent savings with a roommate: 29.47%
    • Monthly rent savings with a roommate: $280
    • One-bedroom rent: $950
    • Two-bedroom rent: $1,340
    1. Denver, CO
    • Percent savings with a roommate: 29.69%
    • Monthly rent savings with a roommate: $475
    • One-bedroom rent: $1,600
    • Two-bedroom rent: $2,250
    1. St Louis, MO
    • Percent savings with a roommate: 30.11%
    • Monthly rent savings with a roommate: $280
    • One-bedroom rent: $930
    • Two-bedroom rent: $1,300
    1. Dallas, TX
    • Percent savings with a roommate: 30.28%
    • Monthly rent savings with a roommate: $430
    • One-bedroom rent: $1,420
    • Two-bedroom rent: $1,980
    1. San Francisco, CA
    • Percent savings with a roommate: 30.47%
    • Monthly rent savings with a roommate: $1,155
    • One-bedroom rent: $3,790
    • Two-bedroom rent: $5,270
    1. Fort Lauderdale, FL
    • Percent savings with a roommate: 30.85%
    • Monthly rent savings with a roommate: $580
    • One-bedroom rent: $1,880
    • Two-bedroom rent: $2,600
    1. St Petersburg, FL
    • Percent savings with a roommate: 31.33%
    • Monthly rent savings with a roommate: $470
    • One-bedroom rent: $1,500
    • Two-bedroom rent: $2,060

    Data and Methodology

    This study examined data from 100 U.S. cities, comparing the average rents for one-bedroom and two-bedroom apartments between March 2025 and March 2026 based on data from Zumper. Specifically, the cost of a one-bedroom was compared with half the cost of a two-bedroom for each city, assuming each roommate pays equal rent.

    This story was produced by SmartAsset and reviewed and distributed by Stacker.

  • Who shops at farmers markets in the US?
    Photo credit: Jason Ardan/The Citizens' Voice via Getty ImagesCustomers browse the fresh produce at a Wilkes-Barre, Pa., farmers market in June 2025.
    ,

    Who shops at farmers markets in the US?

    Six groups explain who shows up and why.

    People who shop at the more than 8,700 farmers markets operating in the U.S. either year-round or seasonally generally fall into six distinct groups. Three of them are more interested in farmers markets than the others. I study local food systems as a strategic communications scholar, and that’s the main takeaway from a study that I conducted with several colleagues.

    As we explained in the March 2026 edition of British Food Journal, people who fall into those groups have different levels of interest in farmers markets but also have some things in common. Most people who shop at them are motivated to go because they want healthy, fresh food, they support local farmers and they think going to the farmers market is fun.

    This is not a niche activity. An earlier study I worked on found that 81% of U.S. adults said that they shop at a farmers market at least once a year.

    For both studies, we pulled survey data from a nationally representative sample of 5,141 U.S. consumers that was conducted Aug. 2-11, 2023. It had a margin of error of plus or minus 1.8 percentage points.

    Researchers define farmers markets and local food in different ways. So we asked respondents to simply think of farmers markets as places where they can buy food directly from more than one vendor and where all or most of the items are locally grown, raised or made. We defined local food as being grown in their state or 250 miles or less from their homes.

    Highly engaged, health-focused and emerging interest

    We determined that about 18% of those surveyed are “highly engaged” farmers market shoppers. They care a lot about food and enjoy buying, preparing and eating fresh food. They are excited about many aspects of farmers markets, which are places where this group shops for a variety of reasons, such as supporting local farmers, buying nutritious, delicious food and connecting with community.

    Nearly 65% of these shoppers were women. This group was the most diverse, with 27% of respondents identifying as Hispanic, 20% Black and 4% multiracial. They also had significantly lower average annual household incomes than other groups, averaging US$40,000-$50,000.

    We found that another 18% of the people surveyed were “health-focused.” Like the highly engaged shoppers, they make buying and eating healthy food a high priority. However, this group doesn’t enjoy cooking as much. The health-focused group tends to avoid genetically modified foods, as well as convenient options like takeout food, frozen dinners and microwave-ready meals.

    About 58% of them were women and their average age was 57, making them the oldest of the groups. Roughly 70% of the health-focused group was white, making it less diverse than the highly engaged group but more diverse than some of the other groups.

    Finally, about 19% of the respondents were what we called “emerging interest” farmers market shoppers. They value convenience and learning about food. This group was the most likely to see going to the farmers market as a fun activity.

    Emerging interest shoppers were nearly evenly split by gender, with 52% women. Their average age was 44 years old, making them the youngest of the groups.

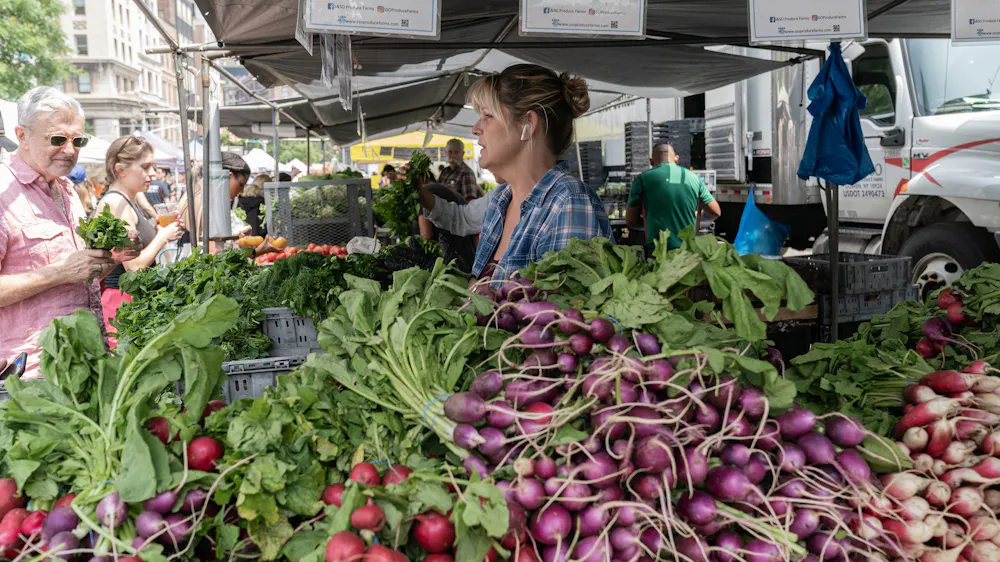
    People buy vegetables from a farmers market vendor
    It’s not always a love of radishes that draws shoppers to these stalls. Lev Radin/Pacific Press/LightRocket via Getty Images

    Convenience, practicality and happenstance

    We also identified three groups of consumers who were less interested in farmers markets than the highly engaged, health-focused and emerging interest shoppers, even if some of them do occasionally shop at the markets anyway.

    About 16% of farmers market shoppers are people we identified as “convenience” shoppers. They are more likely to eat frozen dinners and buy takeout. They rarely cook meals from scratch using produce and other fresh ingredients.

    About 43% of them say they never or rarely shop at a farmers market. Around 59% of them are men and 37% are people of color.

    A vendor sells prepared foods at a market stall.
    Tashana Small sells mac and cheese ‘cupcakes’ topped with pulled pork, Buffalo chicken tenders and Cajun shrimp at a farmers market on Long Island in 2023. Erica Marcus/Newsday RM via Getty Images

    Roughly 17% of these shoppers fall into a “practical” category. They methodically plan their grocery shopping and are among the least interested in farmers markets, with more than half saying that they either rarely or never shop at them.

    Practical consumers were close to evenly split by gender; 53% were women. Their income tended to be the highest of the groups, typically in the $60,000-$75,000 range.

    We called the 12% of the shoppers in the final group we surveyed “uninvolved.” This group showed very little interest in farmers markets or any other food-related activities. About 3 in 4 rarely or never go to farmers markets. Nearly 70% of uninvolved farmers market shoppers were men and 76% were white.

    When someone in the uninvolved group goes to a farmers market, they may be going out of happenstance or because someone in their life wants them to go – not due to any personal interest.

    If you forget, you’ll miss it

    We believe this information could help farmers markets better serve their customers and perhaps attract more shoppers.

    People can, of course, go to farmers markets for more than one reason, and not everybody fits neatly into one of these categories. And everyone we surveyed had something in common: Forgetting to go was the biggest reason shoppers of all kinds didn’t make a trip to the farmers market in a given week.

    This article originally appeared on The Conversation. You can read it here.

  • The salary you need to live comfortably in 100 US cities
    A view of the San Antonio River walkway in San Antonio, Texas.
    ,

    The salary you need to live comfortably in 100 US cities

    Big-city comfort comes with a six-figure price tag.

    Jaclyn DeJohn, CFP for SmartAsset

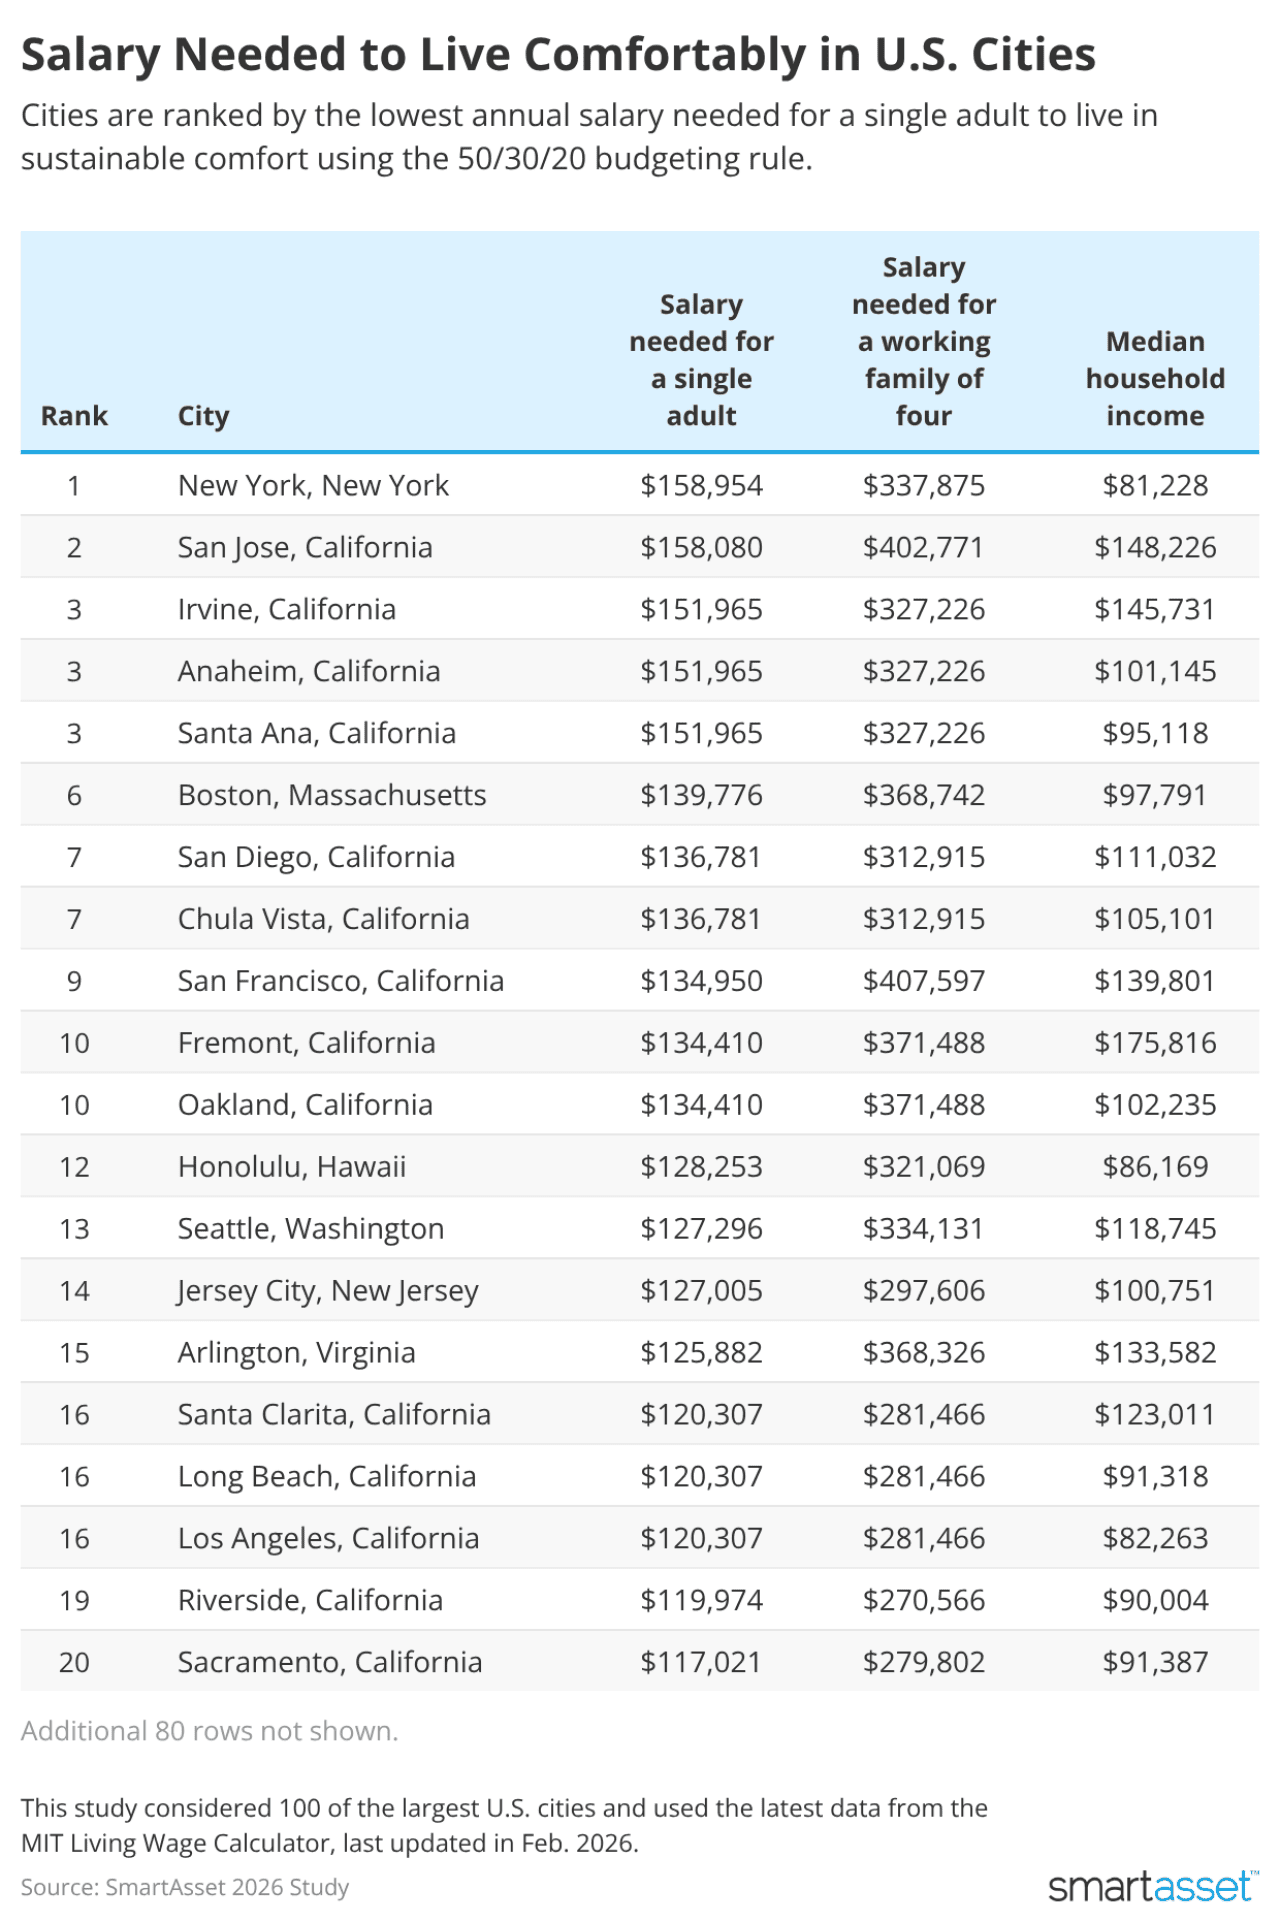
    To truly understand the context of a household’s income, it must be compared to local costs and long-term goals, which both may fluctuate over time. For most people, the same pillars will make up the biggest nonnegotiables in their budget. These include basic necessities like housing, groceries, utilities, and transportation, and likely some discretionary spending on hobbies, activities, and other enrichment. In an attempt to secure this lifestyle for the future, many households aim to save some of their income for emergencies, investments, retirement, education, and other long-term goals. A common budgeting technique that encapsulates these three pillars is called the 50/30/20 rule: 50% of your post-tax income goes to needs, 30% to your wants, and 20% gets set aside for the future.

    With this in mind, SmartAsset assessed the salary needed to reach this 50/30/20 ideal — designated as a comfortable salary — based on the local costs in 100 of the largest U.S. cities.

    Key Findings

    • A single adult needs to earn $150,000 to live comfortably in these places. New York has the highest individual salary needed to live comfortably at $158,954. San Jose, California, follows closely at $158,080. Orange County cities Irvine, Anaheim, and Santa Ana require an estimated $151,965 in income for a single adult.
    • These cities have the lowest salary needed to live comfortably. San Antonio has the lowest salary threshold for both single adults and families of four at $83,242 and $192,608, respectively. New Orleans has the second-lowest salary needed for a single adult to live comfortably at $84,406, followed by Memphis, Tennessee, at $86,320.
    • The Bay Area is the most expensive place for a family to live comfortably. Bay Area cities make up the top four of the five places with the highest salary needed for a family of four to live comfortably. Incomes across two parents are projected at $407,597 in San Francisco, $402,771 in San Jose, and $371,488 in both Fremont and Oakland. Boston rounds out the top five at $368,742.
    • Families in these Texas cities are closest to a comfortable salary. In Frisco, the median household earns $145,444 — substantially higher than the national median of $83,730. This figure also accounts for 63.1% of the $230,464 income a family of four in Frisco needs to live comfortably. In McKinney, the $124,177 median household income accounts for 53.9% of the $230,464 needed.
    Table listing the top cities by the lowest annual salary needed for a single adult to live in sustainable comfort using the 50/30/20 budgeting rule.

    10 Cities With the Highest Salary Needed to Live Comfortably

    1. New York, New York

    • Salary needed for a single adult: $158,954
    • Salary needed for a working family of four: $337,875
    • Median household income: $81,228

    2. San Jose, California

    • Salary needed for a single adult: $158,080
    • Salary needed for a working family of four: $402,771
    • Median household income: $148,226

    3. (tie) Irvine, California

    • Salary needed for a single adult: $151,965
    • Salary needed for a working family of four: $327,226
    • Median household income: $145,731

    3. (tie) Anaheim, California

    • Salary needed for a single adult: $151,965
    • Salary needed for a working family of four: $327,226
    • Median household income: $101,145

    3. (tie) Santa Ana, California

    • Salary needed for a single adult: $151,965
    • Salary needed for a working family of four: $327,226
    • Median household income: $95,118

    6. Boston, Massachusetts

    • Salary needed for a single adult: $139,776
    • Salary needed for a working family of four: $368,742
    • Median household income: $97,791

    7. (tie) San Diego, California

    • Salary needed for a single adult: $136,781
    • Salary needed for a working family of four: $312,915
    • Median household income: $111,032

    7. (tie) Chula Vista, California

    • Salary needed for a single adult: $136,781
    • Salary needed for a working family of four: $312,915
    • Median household income: $105,101

    9. San Francisco, California

    • Salary needed for a single adult: $134,950
    • Salary needed for a working family of four: $407,597
    • Median household income: $139,801

    10. (tie) Fremont, California

    • Salary needed for a single adult: $134,410
    • Salary needed for a working family of four: $371,488
    • Median household income: $175,816

    10. (tie) Oakland, California

    • Salary needed for a single adult: $134,410
    • Salary needed for a working family of four: $371,488
    • Median household income: $102,235

    10 Cities With the Lowest Salary Needed to Live Comfortably

    1. San Antonio, Texas
    • Salary needed for a single adult: $83,242
    • Salary needed for a working family of four: $192,608
    • Median household income: $66,176
    1. New Orleans, Louisiana
    • Salary needed for a single adult: $84,406
    • Salary needed for a working family of four: $197,766
    • Median household income: $58,821
    1. Memphis, Tennessee
    • Salary needed for a single adult: $86,320
    • Salary needed for a working family of four: $193,939
    • Median household income: $52,679
    1. Oklahoma City, Oklahoma
    • Salary needed for a single adult: $86,861
    • Salary needed for a working family of four: $213,325
    • Median household income: $70,040
    1. Baltimore, Maryland
    • Salary needed for a single adult: $87,485
    • Salary needed for a working family of four: $224,224
    • Median household income: $64,778
    1. Louisville, Kentucky
    • Salary needed for a single adult: $88,234
    • Salary needed for a working family of four: $212,742
    • Median household income: $67,251
    1. Tulsa, Oklahoma
    • Salary needed for a single adult: $88,317
    • Salary needed for a working family of four: $215,238
    • Median household income: $60,930
    1. Winston-Salem, North Carolina
    • Salary needed for a single adult: $88,442
    • Salary needed for a working family of four: $205,421
    • Median household income: $57,758
    1. Tucson, Arizona
    • Salary needed for a single adult: $88,899
    • Salary needed for a working family of four: $218,400
    • Median household income: $60,483
    1. Fort Wayne, Indiana
    • Salary needed for a single adult: $88,982
    • Salary needed for a working family of four: $233,126
    • Median household income: $61,436

    Data and Methodology

    SmartAsset used MIT Living Wage Calculator data to gather the basic cost of living for an individual with no children and for two working adults with two children. Data includes the cost of necessities, including housing, food, transportation, and income taxes. It was last updated to reflect the most recent data available on Feb. 15, 2026.

    Applying these costs to the 50/30/20 budget for 100 of the largest U.S. cities, MIT’s living wage is assumed to cover needs (i.e., 50% of one’s budget). From there, the total annual wage was extrapolated for individuals and families to spend 30% of the total on wants and 20% on savings or debt payments. Median household income data for cities comes from the U.S. Census Bureau’s 1 Year American Community Survey for 2024.

    This story was produced by SmartAsset and reviewed and distributed by Stacker.

Explore More Money Stories

Everyday Economics

What a roommate can save you in 100 US cities: 2026 study

Everyday Economics

Who shops at farmers markets in the US?

Everyday Economics

The salary you need to live comfortably in 100 US cities

Smart Spending

8 ways to squeeze more miles from every tank, according to America’s fleet pros