For decades, there has been article after article regarding Millennials and their income holding them back from various milestones such as paying off student loans, homeownership, and even having children. Now, it appears that not much has changed and Gen Z is feeling the hurt in the wallet as well.

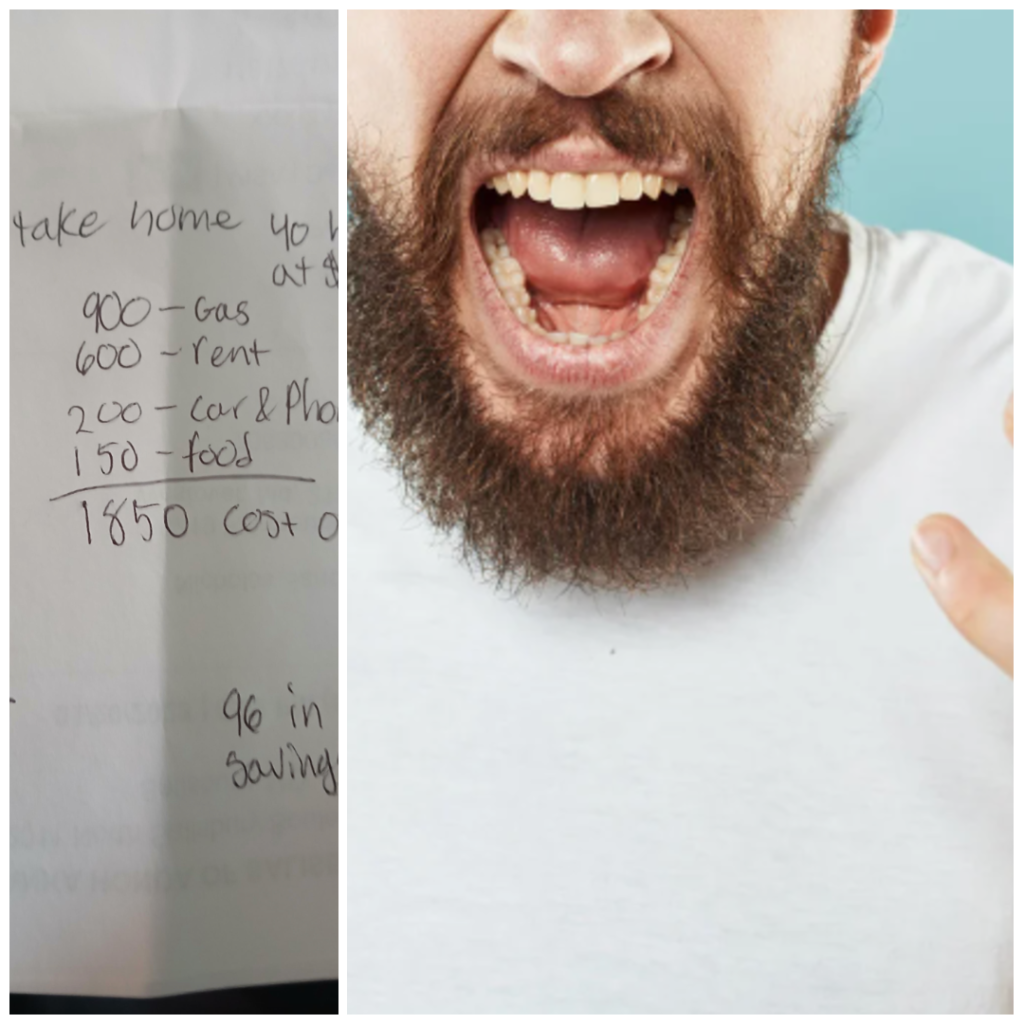
A post on Reddit is making the rounds on the Internet showcasing the budget of a Gen Z worker who is working full time and is still struggling, even though they are living with their parents. After breaking down their monthly earnings with a $16/hour wage, they calculated that after making payments for gas (including fuel for driving his parents and brother around), rent to their parents, food, car payments, and cell phone service, they only take home $96/month in savings. But that little bit of money is one car repair away from disappearing altogether.

The poster continued to share that their parents gave them six months until they had to move out, but that even if they got their raise in four months, it would only be a single dollar per hour more. They also shared that the answer to their problems isn’t “work more hours.”

Empty wallet
Take home pay is becoming less and less as expenses rise year after year. Photo credit: Canva

“I’m showing this to the older generations that say we’re lazy and shit, and I don’t want to hear anything because I’m not allowed overtime and I work 6 days a week,” they wrote.

Other posters shared their thoughts and struggles.

“How do they expect anyone to live on $16/hr when prices have doubled on almost everything?”

“Some states’ minimum wage is still $7.25.”

“Horrible people charging him $600 when he can’t even afford to save.”

“Cost of living is obnoxiously high and wages aren’t nearly high enough to balance out how much it costs to live.”

past due bill
Making bill payments gets harder each year. Photo credit: Canva

While the poster got some advice regarding finding a place closer to his job, investing in a better vehicle, different budget math, and other ways to help make ends meet, the fact remains that Gen Z is falling into the same financial burden that Millennials have long fallen into.

To put things into perspective, the national minimum wage, currently standing at $7.25/hour, was last changed in 2009, back when the oldest Gen Zers were 12 years old. While some states have raised their minimum wage, the lion’s share haven’t raised wages or their raises still wouldn’t make enough difference to help their residents make a living.

Here are some examples using the Massachusetts Institute of Technology (MIT) living wage calculator. Iowa, which has the national limit for minimum wage at $7.25/hour, would require a single person with no kids to make $20.89/hour as a livable wage. Even if you lived in Washington, D.C. which has the highest minimum wage at $17.50/hour, it would require a single person with no kids $25.98 to make ends meet. It should be stressed that those are for folks that live alone without kids, as the cost of living would be even greater should you and your partner have children.

It should also be noted and stressed that the minimum wage was established to help adult workers obtain “purchasing power” for the overall economy, not as a “starter wage” for teenagers and others who are just entering the work force. Its intention was to protect all workers from exploitation from their employers. As the Reddit poster and MIT shows, even $16/hour doesn’t provide much for the modern worker.

As Millennials and Gen Z get older, solidarity will hopefully form and bring about change that will benefit both generations through collective action, changes in economic policy, and life overall.

This article originally appeared in March.

  • The happiest cities in America in 2026, ranked across 11 factors
    A sunrise view of a row of cherry blossom trees and the Rosslyn skyline reflected in the Tidal Basin in Virginia.
    ,

    The happiest cities in America in 2026, ranked across 11 factors

    Arlington leads a data-driven look at where Americans may be happiest.

    Jaclyn DeJohn, CFP for SmartAsset

    Happiness may not be easy to quantify, but some qualifiers may make a person more likely to feel satisfied in life. A reasonable degree of financial freedom can alleviate worry about day-to-day costs and the occasional unexpected expense. Similarly, good relationships, overall health and longevity, basic conveniences, and privacy can go a long way in keeping stress down and contentment up. While none of these things alone are the secret to happiness, they may all individually contribute to a life geared toward wants rather than needs — freeing up time and resources for individuals to explore and build a life on their own terms.

    With this in mind, SmartAsset ranked 85 of the largest U.S. cities with available data based on 11 happiness factors spanning personal finance, physical and mental well-being, and quality of life factors.

    Key Findings

    • Arlington, VA, ranks as the happiest city for 2026. Arlington ranks among the top five cities for a variety of happiness metrics, including life expectancy (83.9 years), household earnings over $100,000 (64.3%), mentally healthy days (84.9%), adults getting exercise (83%), and access to activity spaces (100%).
    • Fremont, CA, households outearn their peers. Ranking second overall for happiest cities, 70.7% of Fremont households earn over $100,000, the most studywide. This pairs with the lowest poverty rate of 4.7%. However, 18.1% of households in Fremont end up spending 50% or more of their income on housing. In tandem, the population maintains the highest rate of health insurance coverage and marriage, at 98.1% and 63.8%, respectively.
    • Austin, TX, has the least traffic. The traffic volume per meter in Austin, Texas — a practice ground for many autonomous vehicle companies — is lowest studywide at 42.1. This pales in comparison to Boston, which has over 40 times the traffic volume per meter at 1753.9. The average traffic volume per meter is 299.
    • Residents have the most mentally healthy days in Honolulu. Ranking 16th happiest overall, Honolulu residents feel mentally healthy for 85.2% of days. San Jose, California, follows closely at 85% mentally healthy days. On the other end of the spectrum, the residents of Toledo, Ohio, have the worst mental health ranking, at 78.2% of days spent mentally healthy.
    • These California cities have the most overcrowding in housing. Privacy and space can go a long way in making a person comfortable in their own space, and can be indicative of financial resources. In Long Beach, Los Angeles, and Fresno, just over 10% of households are home to more than one person per bedroom. Laredo, Texas, also falls into this category of high overcrowding. Meanwhile, Pittsburgh has the lowest rate of overcrowding at 0.9%.
    Table listing the top cities where Americans are happiest.

    Top 25 Happiest Cities

    1. Arlington, VA
    • Households earning $100k+: 64.3%
    • Poverty rate: 8.3%
    • Households spending >50% of income on housing: 14.2%
    • Poor mental health days: 15.1%
    • Life expectancy (years): 83.9
    • Percent of adults getting exercise: 83%
    • Population with health insurance: 93.9%
    • Marriage rate: 44.2%
    • Traffic volume per meter: 540
    • Access to activity space: 100%
    • Overcrowded households: 3.4%
    1. Fremont, CA
    • Households earning $100k+: 70.7%
    • Poverty rate: 4.7%
    • Households spending >50% of income on housing: 18.1%
    • Poor mental health days: 17.8%
    • Life expectancy (years): 82
    • Percent of adults getting exercise: 81.2%
    • Population with health insurance: 98.1%
    • Marriage rate: 63.8%
    • Traffic volume per meter: 683
    • Access to activity space: 99.6%
    • Overcrowded households: 7.7%
    1. San Jose, CA
    • Households earning $100k+: 64.2%
    • Poverty rate: 8.1%
    • Households spending >50% of income on housing: 15.7%
    • Poor mental health days: 15%
    • Life expectancy (years): 83.8
    • Percent of adults getting exercise: 80.9%
    • Population with health insurance: 95.6%
    • Marriage rate: 48.6%
    • Traffic volume per meter: 626.4
    • Access to activity space: 99.4%
    • Overcrowded households: 7.9%
    1. Seattle, WA
    • Households earning $100k+: 57.1%
    • Poverty rate: 9.4%
    • Households spending >50% of income on housing: 15%
    • Poor mental health days: 16.6%
    • Life expectancy (years): 81.1
    • Percent of adults getting exercise: 86.7%
    • Population with health insurance: 96.3%
    • Marriage rate: 39.5%
    • Traffic volume per meter: 333
    • Access to activity space: 97.9%
    • Overcrowded households: 3.9%
    1. Raleigh, NC
    • Households earning $100k+: 43%
    • Poverty rate: 13.3%
    • Households spending >50% of income on housing: 12%
    • Poor mental health days: 15.7%
    • Life expectancy (years): 81
    • Percent of adults getting exercise: 84.2%
    • Population with health insurance: 92.9%
    • Marriage rate: 38.8%
    • Traffic volume per meter: 111.6
    • Access to activity space: 98.6%
    • Overcrowded households: 2%
    1. Boise, ID
    • Households earning $100k+: 39.9%
    • Poverty rate: 12.9%
    • Households spending >50% of income on housing: 10.9%
    • Poor mental health days: 17.1%
    • Life expectancy (years): 79.7
    • Percent of adults getting exercise: 82.4%
    • Population with health insurance: 93.1%
    • Marriage rate: 44.2%
    • Traffic volume per meter: 116.7
    • Access to activity space: 91.6%
    • Overcrowded households: 1.9%
    1. Lincoln, NE
    • Households earning $100k+: 33.5%
    • Poverty rate: 13.4%
    • Households spending >50% of income on housing: 12.6%
    • Poor mental health days: 15.3%
    • Life expectancy (years): 79.1
    • Percent of adults getting exercise: 78.9%
    • Population with health insurance: 93.4%
    • Marriage rate: 47%
    • Traffic volume per meter: 211.1
    • Access to activity space: 95.4%
    • Overcrowded households: 2.2%
    1. Anchorage, AK
    • Households earning $100k+: 53.9%
    • Poverty rate: 8.3%
    • Households spending >50% of income on housing: 13.2%
    • Poor mental health days: 16.3%
    • Life expectancy (years): 76.3
    • Percent of adults getting exercise: 80.1%
    • Population with health insurance: 90.6%
    • Marriage rate: 48.7%
    • Traffic volume per meter: 152.3
    • Access to activity space: 93.9%
    • Overcrowded households: 4.5%
    1. San Francisco, CA
    • Households earning $100k+: 61%
    • Poverty rate: 11.3%
    • Households spending >50% of income on housing: 16.9%
    • Poor mental health days: 16.6%
    • Life expectancy (years): 82.4
    • Percent of adults getting exercise: 83.6%
    • Population with health insurance: 97.2%
    • Marriage rate: 39.1%
    • Traffic volume per meter: 794
    • Access to activity space: 100%
    • Overcrowded households: 6.8%
    1. Minneapolis, MN
    • Households earning $100k+: 40.3%
    • Poverty rate: 15.1%
    • Households spending >50% of income on housing: 13.4%
    • Poor mental health days: 16.1%
    • Life expectancy (years): 79.5
    • Percent of adults getting exercise: 83.3%
    • Population with health insurance: 94.3%
    • Marriage rate: 34%
    • Traffic volume per meter: 304.6
    • Access to activity space: 99.1%
    • Overcrowded households: 2.7%
    1. Colorado Springs, CO
    • Households earning $100k+: 41.6%
    • Poverty rate: 8.8%
    • Households spending >50% of income on housing: 14.4%
    • Poor mental health days: 18.4%
    • Life expectancy (years): 76.2
    • Percent of adults getting exercise: 81.5%
    • Population with health insurance: 91.5%
    • Marriage rate: 52.6%
    • Traffic volume per meter: 140.9
    • Access to activity space: 89.8%
    • Overcrowded households: 2.5%
    1. Aurora, CO
    • Households earning $100k+: 46.4%
    • Poverty rate: 10.7%
    • Households spending >50% of income on housing: 15.6%
    • Poor mental health days: 17.1%
    • Life expectancy (years): 79.1
    • Percent of adults getting exercise: 82.4%
    • Population with health insurance: 85.6%
    • Marriage rate: 44.9%
    • Traffic volume per meter: 215.2
    • Access to activity space: 97.5%
    • Overcrowded households: 3%
    1. Charlotte, NC
    • Households earning $100k+: 43.7%
    • Poverty rate: 11.9%
    • Households spending >50% of income on housing: 14.3%
    • Poor mental health days: 16.3%
    • Life expectancy (years): 78.8
    • Percent of adults getting exercise: 81.1%
    • Population with health insurance: 87.9%
    • Marriage rate: 40.4%
    • Traffic volume per meter: 165.5
    • Access to activity space: 88.7%
    • Overcrowded households: 2.3%
    1. Omaha, NE
    • Households earning $100k+: 35.5%
    • Poverty rate: 14.2%
    • Households spending >50% of income on housing: 13.1%
    • Poor mental health days: 15.9%
    • Life expectancy (years): 77.7
    • Percent of adults getting exercise: 75.7%
    • Population with health insurance: 91.2%
    • Marriage rate: 44.3%
    • Traffic volume per meter: 214.9
    • Access to activity space: 97.4%
    • Overcrowded households: 2.1%
    1. Chula Vista, CA
    • Households earning $100k+: 52%
    • Poverty rate: 9.6%
    • Households spending >50% of income on housing: 20.8%
    • Poor mental health days: 17.3%
    • Life expectancy (years): 80.3
    • Percent of adults getting exercise: 81.7%
    • Population with health insurance: 94.8%
    • Marriage rate: 50.2%
    • Traffic volume per meter: 440.1
    • Access to activity space: 97.5%
    • Overcrowded households: 6.9%
    1. Honolulu, HI
    • Households earning $100k+: 44.5%
    • Poverty rate: 10.5%
    • Households spending >50% of income on housing: 19.4%
    • Poor mental health days: 14.8%
    • Life expectancy (years): 81.7
    • Percent of adults getting exercise: 77.8%
    • Population with health insurance: 96.8%
    • Marriage rate: 45.1%
    • Traffic volume per meter: 536.2
    • Access to activity space: 96.6%
    • Overcrowded households: 8.7%
    1. San Diego, CA
    • Households earning $100k+: 55.3%
    • Poverty rate: 10.4%
    • Households spending >50% of income on housing: 20.8%
    • Poor mental health days: 17.3%
    • Life expectancy (years): 80.3
    • Percent of adults getting exercise: 81.7%
    • Population with health insurance: 94.3%
    • Marriage rate: 43.9%
    • Traffic volume per meter: 440.1
    • Access to activity space: 97.5%
    • Overcrowded households: 6.9%
    1. Lexington, KY
    • Households earning $100k+: 34.2%
    • Poverty rate: 12.1%
    • Households spending >50% of income on housing: 14.7%
    • Poor mental health days: 17.4%
    • Life expectancy (years): 76.7
    • Percent of adults getting exercise: 77.1%
    • Population with health insurance: 91.9%
    • Marriage rate: 42.5%
    • Traffic volume per meter: 163.7
    • Access to activity space: 97.4%
    • Overcrowded households: 2.2%
    1. Mesa, AZ
    • Households earning $100k+: 41.9%
    • Poverty rate: 10.8%
    • Households spending >50% of income on housing: 14.2%
    • Poor mental health days: 18.2%
    • Life expectancy (years): 77.5
    • Percent of adults getting exercise: 78%
    • Population with health insurance: 89%
    • Marriage rate: 48.5%
    • Traffic volume per meter: 244.2
    • Access to activity space: 92.8%
    • Overcrowded households: 4.4%
    1. Pittsburgh, PA
    • Households earning $100k+: 33.2%
    • Poverty rate: 20.1%
    • Households spending >50% of income on housing: 11.9%
    • Poor mental health days: 17.9%
    • Life expectancy (years): 76.9
    • Percent of adults getting exercise: 79%
    • Population with health insurance: 96%
    • Marriage rate: 33.6%
    • Traffic volume per meter: 202.3
    • Access to activity space: 93.3%
    • Overcrowded households: 0.9%
    1. Denver, CO
    • Households earning $100k+: 46.8%
    • Poverty rate: 12.1%
    • Households spending >50% of income on housing: 16.3%
    • Poor mental health days: 18.3%
    • Life expectancy (years): 77.4
    • Percent of adults getting exercise: 78.8%
    • Population with health insurance: 90.7%
    • Marriage rate: 40.5%
    • Traffic volume per meter: 415.7
    • Access to activity space: 99.1%
    • Overcrowded households: 3.1%
    1. Oakland, CA
    • Households earning $100k+: 51.2%
    • Poverty rate: 11.9%
    • Households spending >50% of income on housing: 18.1%
    • Poor mental health days: 17.8%
    • Life expectancy (years): 82
    • Percent of adults getting exercise: 81.2%
    • Population with health insurance: 94.1%
    • Marriage rate: 38.3%
    • Traffic volume per meter: 683
    • Access to activity space: 99.6%
    • Overcrowded households: 7.7%
    1. Spokane, WA
    • Households earning $100k+: 38.4%
    • Poverty rate: 12.7%
    • Households spending >50% of income on housing: 13.9%
    • Poor mental health days: 19.9%
    • Life expectancy (years): 76.9
    • Percent of adults getting exercise: 79.6%
    • Population with health insurance: 93.7%
    • Marriage rate: 41.9%
    • Traffic volume per meter: 150.4
    • Access to activity space: 87.6%
    • Overcrowded households: 2.1%
    1. Atlanta, GA
    • Households earning $100k+: 45.4%
    • Poverty rate: 15.8%
    • Households spending >50% of income on housing: 17.3%
    • Poor mental health days: 15.9%
    • Life expectancy (years): 77.5
    • Percent of adults getting exercise: 80%
    • Population with health insurance: 91.4%
    • Marriage rate: 31.8%
    • Traffic volume per meter: 384
    • Access to activity space: 93.8%
    • Overcrowded households: 2%
    1. Henderson, NV
    • Households earning $100k+: 48.3%
    • Poverty rate: 8.8%
    • Households spending >50% of income on housing: 18.5%
    • Poor mental health days: 18.4%
    • Life expectancy (years): 76.6
    • Percent of adults getting exercise: 73%
    • Population with health insurance: 94.2%
    • Marriage rate: 48%
    • Traffic volume per meter: 196.6
    • Access to activity space: 95.7%
    • Overcrowded households: 4.4%

    Data and Methodology

    Eighty-five of the largest U.S. cities for which data was available were evaluated across three categories: personal finance, well-being, and quality of life. Data comes from the U.S. Census Bureau 1-Year American Community Survey for 2024 and the County Health Rankings & Roadmaps for 2025.

    Personal finance metrics included:

    • Percent of individuals earning $100,000 or more.
    • Percent of households that spend 50% or more of their income on housing.
    • Percent of residents below the poverty level.

    Well-being metrics include:

    • Average percentage of days spent with poor mental health
    • Life expectancy in years.
    • Percentage of residents getting exercise.
    • Percentage of residents who have health insurance.

    Quality of life metrics include:

    • Marriage rate.
    • Average traffic volume per meter of major roadways in the county.
    • Percentage of population with adequate access to locations for physical activity.
    • Percentage of households with overcrowding, defined as more than one person living in a room.

    This story was produced by SmartAsset and reviewed and distributed by Stacker.

  • A millionaire swapped lives with a struggling family for a week on a $230 budget. The money wasn’t what broke him.
    Photo credit: CanvaDepressed man looks at his laptop.

    Matt Fiddes runs a multi-million dollar martial arts franchise in Britain. His family’s weekly budget runs around $2,058. He’d never really looked at a price tag before buying something.

    For a social experiment documented by the YouTube channel Only Human, the Fiddes family swapped lives with the Leamons (Andy, Kim, their two kids, and two dogs) who get by on $230 a week. Kim had a life-saving surgery after an accident and now lives with Chronic Regional Pain Syndrome. They lost their savings. Andy works alone to support the family.

    On day one of the swap, Matt learned his weekly budget was $230. “That basically fills up the fuel tank of my car,” he said.

    wealth inequality, poverty, social experiment, class, viral video
    A man calculating his budget on his laptop. Photo credit: Canva

    What followed was a week of grocery bills he had to think about, a neighborhood with nothing much in it, and night shifts, something he’d never worked in his life. His wife Moniqe cried when she heard about Kim’s condition from the Leamons’ friends.

    By the end of the week, Matt had something to say that was harder to shrug off than the budget: “I feel guilty; no one should live like this.”

    He also said the week brought his family closer together. The Fiddes left a gift behind for the Leamons when they returned home: a mobility scooter for Kim, so she could get around on her own.

    The Leamons, meanwhile, spent the week in the Fiddes’ house taking their kids to a theme park and doing a little shopping experiencing, briefly, what it feels like when money isn’t a constant calculation.

    One YouTube commenter put it plainly: “I feel this was a much-needed vacation for the poor family and a grounding experience for the rich family.” That’s about right.

    You can watch the full documentary here:

  • Illustrator says the best way to stay motivated when learning a new hobby is to spend money
    Photo credit: CanvaThere's a way to stay motivated while continuing to enjoy your hobby.

    Starting a hobby and keeping at it can be difficult. A person might feel discouraged because they aren’t good at it from the get-go. Another person might enjoy it fully but think their time and/or money could be put to better use. Embroidery illustrator and author Sara Barnes offers a tip that can help people stay motivated in their pastime: investing in professional resources and equipment.

    Barnes argues that, while experimenting with a new hobby on your own can be fulfilling, putting money towards classes taught by professionals can help a hobbyist stay motivated to grow and further enjoy it. Depending on your hobby, purchasing professional-grade equipment can keep you interested and invested. The thought process behind it is that, if a person spends money on a hobby, they’re more likely to stick with it to justify the cost.

    @artist.mackenzie

    Always buy the best art materials ❤️ Top tips for artists. Buy the best you can afford. Like all things in life there are levels and I truly believe that the better quality of tools can help in no end. There are times when I look at the colours I’m able to make with my pastels and think ‘how is that possible’ it amazes me. ❤️ Same goes for my paper, sculptures etc etc. ❤️ This if from a list in the book of top tips for artists ❤️ Art for all ❤️

    ♬ original sound – Artist Mackenzie

    Spending money literally makes you more invested

    A painting class taught by a pro means person-to-person input and lessons. These advantages expand your knowledge and skill, encouraging you to play around with more techniques as you learn and grow. After all, it’s hard to keep a hobby without a sense of growth or accomplishment attached to it.

    Signing up for professional boxing training forces you to get off the couch and grab your gloves. In return, you’ll learn more about boxing, get quality exercise, and have fun incorporated into your schedule. Also, investing in quality gloves will similarly motivate you to be intentional about your training.

    Purchasing expensive gear and supplies for a simple hobby you might not maintain may sound risky or foolish, especially given the current state of the US economy. On the contrary, it can be a quality investment of both money and time. During the peak of the COVID-19 pandemic and its economic uncertainty, hobbies were necessary investments to promote good physical, mental, and social health.

    @edwina.co

    JUNE 2025: hobby costs + me realising why I still need to work my corporate job 🫠 Money can’t buy happiness, but it can fund all your interests and hobbies #hobby #hobbies #corporatemillennial #adultmoney #corporategirlies #hobbygirlsummer

    ♬ Bossa Nova jazz that seems to fit in a cafe(1433079) – TAKANORI ONDA

    Pricier classes and equipment might actually save money on hobbies

    Even financial experts recommend investing in your hobbies as long as you’re not taking on debt to pursue them. They say it might even improve your budget. 

    After all, budgeting for an expensive pair of high-quality running shoes only once will end up being less expensive than paying for monthly streaming services you barely watch. Getting a pricier but sturdier table saw for woodworking will save money  compared to frequently buying replacement parts when cheaper models break. Taking a cooking class can encourage you to cook more at home and eat out less in the long term.

    On the surface, it may look silly to spend money on a weird color of paint, professional-grade ice skates, or a Thai recipe cooking class, but what you’re really spending money on is your well-being. Hobbies not only provide mental breaks from the stress in life, they offer opportunities to socialize with and befriend others who share your interests.

    With time and experience, the initial investment in your hobby will become cheaper. You’ll either already own the equipment needed to do the hobby, have enough expertise to pursue it without attending a class, or both. It depends on what hobbies you pursue and enjoy, but this philosophy can apply to almost anything.

    So, while figuring out where to invest your money, consider making your hobby a priority. It not only keeps you motivated, but can provide a positive impact on your body, mind, and long-term finances, too.

Explore More Everyday Economics Stories

Money

A millionaire swapped lives with a struggling family for a week on a $230 budget. The money wasn’t what broke him.

Everyday Economics

Illustrator says the best way to stay motivated when learning a new hobby is to spend money

Everyday Economics

Driver breaks down how much he makes from Uber, enraging both drivers and passengers

Everyday Economics

Are you a good tipper? Turns out your generation might have something to do with it.