General happiness is really important. We’re constantly looking for a quick fix solution to make us feel better. But many of us are using tools to aid this endeavor that actually hurt our mental health. A licensed therapist and popular TikTok creator focused on mental health content and awareness, Jeffrey Meltzer (@therapytothepoint), posted a video to talk through the ’10 Habits that worsen your mental health.’

He brings up some specific behaviors and activities many of us do on the daily, and explains how damaging they can be to our mental well-being. He gives some basics to the cause and effects of each behavior, too, which is helpful. However, the best part is that he offers actual solutions to the problems.

Just because we want to be happy doesn’t mean we are. According to the World Happiness Report 2025, the U.S. placed 24th out of the 147 countries studied. That’s the lowest rating since back in 2012. Why is our happiness declining? There are certainly a lot of reasons, but let’s look at some of the habits we’ve wrapped ourselves up in that are making us less happy.


1. Scrolling your phone

First thing you do when you wake up in the morning is jump on that phone and start scrolling social media. Meltzer states you’re over stimulating your brain before being ready for the day ahead. The solution? Connect with a person or pet instead. Wait at least 30 minutes before you get into that daily scroll.

2. Staying inside all day

With so many things available (streaming, smartphones, DoorDash, UberEats, home delivery) that conveniently bring life to us staying at home all day long is easier than it used to be. Meltzer states it can make us feel sluggish and grow more anxious. The solution? Get outside even for just five minutes. The sunlight and fresh air makes a world of difference.

3. Constantly watching the news

news, social media, trusted sources, fear, negativity, mental bandwidth, scrolling
Newspaper with 'This is Bad' headline. media1.giphy.com

It’s probably not a surprise, but constantly keeping up with the news overloads your thoughts with fear and negativity. To combat this, limiting your news watching and scrolling to once a day and stick with one or two reliable news sources rather than ALL the news sources.

4. Comparing yourself to others

Meltzer says this behavior chips away at our self esteem and distorts our perspective on what’s real. Help yourself by limiting your social media consumption and try to shift your perspective of comparison toward learning instead. Does this person look happier, thinner, or better? What are they doing in their life that’s good for them that you can do too? That’s more productive than just putting yourself down.

5. Constantly complaining

Meltzer claims that constantly complaining will trap your brain in a cycle of repeated negativity. One solution is to set a timer. Allow yourself to go off and rant on whatever topic is bothering you. Then after the timer is up, try and shift your thinking toward more positive and useful thoughts.

6. Not moving your body

Beyonce, dancing, exercise, joyful expression, celebrity, talented artist, creative movements
Beyonce dancing and moving her body. media4.giphy.com

Not moving your body for long periods of time doesn’t actually charge up your batteries. It makes you feel sluggish and lowers your overall energy. Instead, kill two birds with one stone and get outside for a short walk. If you can’t head outside for any reason, try stretching every few hours.

7. Eating what’s convenient

It can be really hard not to grab the easier, and often unhealthier, meal when we’re busy and on the go. Meltzer states that what we’re eating has a direct effect on our mood, focus, and over all energy levels. Fix this by try doing some meal prepping. Making snacks that are healthy and ready to go keeps things convenient and healthy.

8. Overspending

This one can be difficult to recognize sometimes, especially because of the immediate gratification spending brings. However, concerns over money inevitably brings long-term stress. Meltzer suggests budgeting for small treats that will bring short-term happiness without the long-term guilt.

9. Saying ‘yes’ when you mean ‘no’

Yellowstone, Paramount Network, Monica, popular tv, TV, celebrity, actors
Monica on the show 'Yellowstone. media4.giphy.com

Saying “no” can be really challenging for the people pleasers out there and most of us in general. Saying an unwanted “yes,” however, quickly builds resentment and adds to our already growing emotional fatigue. Meltzer reminds viewer it’s okay to possibly disappoint other people with our “no” and assures that “it won’t be the end of the world.”

10. Ignoring your feelings

In case you didn’t know: ignored feelings build up over time; they don’t actually just go away. Meltzer warns that we can become disconnected from ourselves if ignore what we’re actually feeling and experiencing for too long. Instead, Meltzer says it’s important to learn how to lean into them. If we allow our feelings to exist and equip ourselves to work through them through therapy, medication, and/or mindfulness techniques, we can learn to release the negativity so that we’re more regulated in body and mind.

  • The salary you need to live comfortably in 100 US cities
    A view of the San Antonio River walkway in San Antonio, Texas.
    ,

    The salary you need to live comfortably in 100 US cities

    Big-city comfort comes with a six-figure price tag.

    Jaclyn DeJohn, CFP for SmartAsset

    To truly understand the context of a household’s income, it must be compared to local costs and long-term goals, which both may fluctuate over time. For most people, the same pillars will make up the biggest nonnegotiables in their budget. These include basic necessities like housing, groceries, utilities, and transportation, and likely some discretionary spending on hobbies, activities, and other enrichment. In an attempt to secure this lifestyle for the future, many households aim to save some of their income for emergencies, investments, retirement, education, and other long-term goals. A common budgeting technique that encapsulates these three pillars is called the 50/30/20 rule: 50% of your post-tax income goes to needs, 30% to your wants, and 20% gets set aside for the future.

    With this in mind, SmartAsset assessed the salary needed to reach this 50/30/20 ideal — designated as a comfortable salary — based on the local costs in 100 of the largest U.S. cities.

    Key Findings

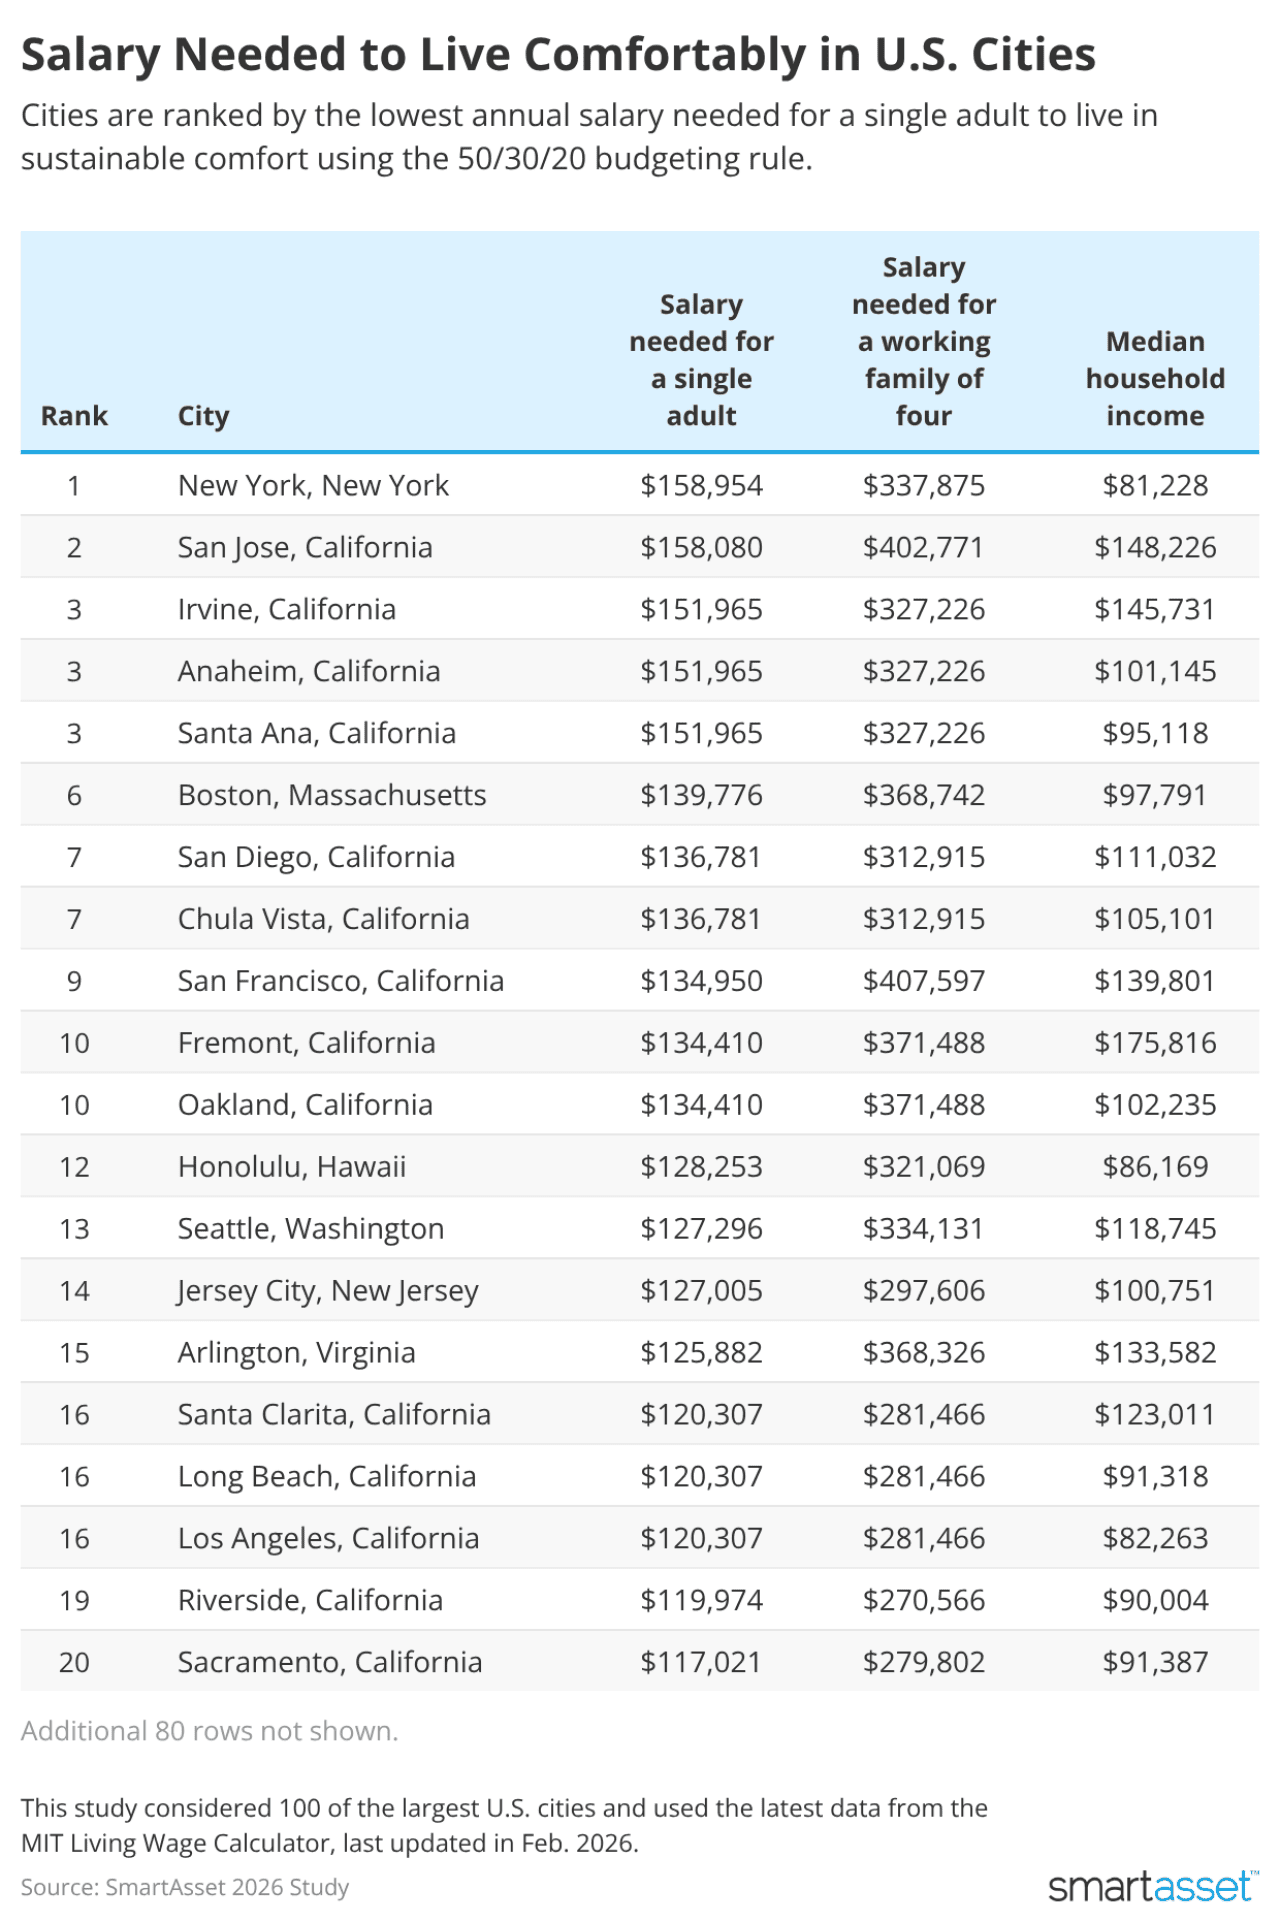
    • A single adult needs to earn $150,000 to live comfortably in these places. New York has the highest individual salary needed to live comfortably at $158,954. San Jose, California, follows closely at $158,080. Orange County cities Irvine, Anaheim, and Santa Ana require an estimated $151,965 in income for a single adult.
    • These cities have the lowest salary needed to live comfortably. San Antonio has the lowest salary threshold for both single adults and families of four at $83,242 and $192,608, respectively. New Orleans has the second-lowest salary needed for a single adult to live comfortably at $84,406, followed by Memphis, Tennessee, at $86,320.
    • The Bay Area is the most expensive place for a family to live comfortably. Bay Area cities make up the top four of the five places with the highest salary needed for a family of four to live comfortably. Incomes across two parents are projected at $407,597 in San Francisco, $402,771 in San Jose, and $371,488 in both Fremont and Oakland. Boston rounds out the top five at $368,742.
    • Families in these Texas cities are closest to a comfortable salary. In Frisco, the median household earns $145,444 — substantially higher than the national median of $83,730. This figure also accounts for 63.1% of the $230,464 income a family of four in Frisco needs to live comfortably. In McKinney, the $124,177 median household income accounts for 53.9% of the $230,464 needed.
    Table listing the top cities by the lowest annual salary needed for a single adult to live in sustainable comfort using the 50/30/20 budgeting rule.

    10 Cities With the Highest Salary Needed to Live Comfortably

    1. New York, New York

    • Salary needed for a single adult: $158,954
    • Salary needed for a working family of four: $337,875
    • Median household income: $81,228

    2. San Jose, California

    • Salary needed for a single adult: $158,080
    • Salary needed for a working family of four: $402,771
    • Median household income: $148,226

    3. (tie) Irvine, California

    • Salary needed for a single adult: $151,965
    • Salary needed for a working family of four: $327,226
    • Median household income: $145,731

    3. (tie) Anaheim, California

    • Salary needed for a single adult: $151,965
    • Salary needed for a working family of four: $327,226
    • Median household income: $101,145

    3. (tie) Santa Ana, California

    • Salary needed for a single adult: $151,965
    • Salary needed for a working family of four: $327,226
    • Median household income: $95,118

    6. Boston, Massachusetts

    • Salary needed for a single adult: $139,776
    • Salary needed for a working family of four: $368,742
    • Median household income: $97,791

    7. (tie) San Diego, California

    • Salary needed for a single adult: $136,781
    • Salary needed for a working family of four: $312,915
    • Median household income: $111,032

    7. (tie) Chula Vista, California

    • Salary needed for a single adult: $136,781
    • Salary needed for a working family of four: $312,915
    • Median household income: $105,101

    9. San Francisco, California

    • Salary needed for a single adult: $134,950
    • Salary needed for a working family of four: $407,597
    • Median household income: $139,801

    10. (tie) Fremont, California

    • Salary needed for a single adult: $134,410
    • Salary needed for a working family of four: $371,488
    • Median household income: $175,816

    10. (tie) Oakland, California

    • Salary needed for a single adult: $134,410
    • Salary needed for a working family of four: $371,488
    • Median household income: $102,235

    10 Cities With the Lowest Salary Needed to Live Comfortably

    1. San Antonio, Texas
    • Salary needed for a single adult: $83,242
    • Salary needed for a working family of four: $192,608
    • Median household income: $66,176
    1. New Orleans, Louisiana
    • Salary needed for a single adult: $84,406
    • Salary needed for a working family of four: $197,766
    • Median household income: $58,821
    1. Memphis, Tennessee
    • Salary needed for a single adult: $86,320
    • Salary needed for a working family of four: $193,939
    • Median household income: $52,679
    1. Oklahoma City, Oklahoma
    • Salary needed for a single adult: $86,861
    • Salary needed for a working family of four: $213,325
    • Median household income: $70,040
    1. Baltimore, Maryland
    • Salary needed for a single adult: $87,485
    • Salary needed for a working family of four: $224,224
    • Median household income: $64,778
    1. Louisville, Kentucky
    • Salary needed for a single adult: $88,234
    • Salary needed for a working family of four: $212,742
    • Median household income: $67,251
    1. Tulsa, Oklahoma
    • Salary needed for a single adult: $88,317
    • Salary needed for a working family of four: $215,238
    • Median household income: $60,930
    1. Winston-Salem, North Carolina
    • Salary needed for a single adult: $88,442
    • Salary needed for a working family of four: $205,421
    • Median household income: $57,758
    1. Tucson, Arizona
    • Salary needed for a single adult: $88,899
    • Salary needed for a working family of four: $218,400
    • Median household income: $60,483
    1. Fort Wayne, Indiana
    • Salary needed for a single adult: $88,982
    • Salary needed for a working family of four: $233,126
    • Median household income: $61,436

    Data and Methodology

    SmartAsset used MIT Living Wage Calculator data to gather the basic cost of living for an individual with no children and for two working adults with two children. Data includes the cost of necessities, including housing, food, transportation, and income taxes. It was last updated to reflect the most recent data available on Feb. 15, 2026.

    Applying these costs to the 50/30/20 budget for 100 of the largest U.S. cities, MIT’s living wage is assumed to cover needs (i.e., 50% of one’s budget). From there, the total annual wage was extrapolated for individuals and families to spend 30% of the total on wants and 20% on savings or debt payments. Median household income data for cities comes from the U.S. Census Bureau’s 1 Year American Community Survey for 2024.

    This story was produced by SmartAsset and reviewed and distributed by Stacker.

  • The happiest cities in America in 2026, ranked across 11 factors
    A sunrise view of a row of cherry blossom trees and the Rosslyn skyline reflected in the Tidal Basin in Virginia.
    ,

    The happiest cities in America in 2026, ranked across 11 factors

    Arlington leads a data-driven look at where Americans may be happiest.

    Jaclyn DeJohn, CFP for SmartAsset

    Happiness may not be easy to quantify, but some qualifiers may make a person more likely to feel satisfied in life. A reasonable degree of financial freedom can alleviate worry about day-to-day costs and the occasional unexpected expense. Similarly, good relationships, overall health and longevity, basic conveniences, and privacy can go a long way in keeping stress down and contentment up. While none of these things alone are the secret to happiness, they may all individually contribute to a life geared toward wants rather than needs — freeing up time and resources for individuals to explore and build a life on their own terms.

    With this in mind, SmartAsset ranked 85 of the largest U.S. cities with available data based on 11 happiness factors spanning personal finance, physical and mental well-being, and quality of life factors.

    Key Findings

    • Arlington, VA, ranks as the happiest city for 2026. Arlington ranks among the top five cities for a variety of happiness metrics, including life expectancy (83.9 years), household earnings over $100,000 (64.3%), mentally healthy days (84.9%), adults getting exercise (83%), and access to activity spaces (100%).
    • Fremont, CA, households outearn their peers. Ranking second overall for happiest cities, 70.7% of Fremont households earn over $100,000, the most studywide. This pairs with the lowest poverty rate of 4.7%. However, 18.1% of households in Fremont end up spending 50% or more of their income on housing. In tandem, the population maintains the highest rate of health insurance coverage and marriage, at 98.1% and 63.8%, respectively.
    • Austin, TX, has the least traffic. The traffic volume per meter in Austin, Texas — a practice ground for many autonomous vehicle companies — is lowest studywide at 42.1. This pales in comparison to Boston, which has over 40 times the traffic volume per meter at 1753.9. The average traffic volume per meter is 299.
    • Residents have the most mentally healthy days in Honolulu. Ranking 16th happiest overall, Honolulu residents feel mentally healthy for 85.2% of days. San Jose, California, follows closely at 85% mentally healthy days. On the other end of the spectrum, the residents of Toledo, Ohio, have the worst mental health ranking, at 78.2% of days spent mentally healthy.
    • These California cities have the most overcrowding in housing. Privacy and space can go a long way in making a person comfortable in their own space, and can be indicative of financial resources. In Long Beach, Los Angeles, and Fresno, just over 10% of households are home to more than one person per bedroom. Laredo, Texas, also falls into this category of high overcrowding. Meanwhile, Pittsburgh has the lowest rate of overcrowding at 0.9%.
    Table listing the top cities where Americans are happiest.

    Top 25 Happiest Cities

    1. Arlington, VA
    • Households earning $100k+: 64.3%
    • Poverty rate: 8.3%
    • Households spending >50% of income on housing: 14.2%
    • Poor mental health days: 15.1%
    • Life expectancy (years): 83.9
    • Percent of adults getting exercise: 83%
    • Population with health insurance: 93.9%
    • Marriage rate: 44.2%
    • Traffic volume per meter: 540
    • Access to activity space: 100%
    • Overcrowded households: 3.4%
    1. Fremont, CA
    • Households earning $100k+: 70.7%
    • Poverty rate: 4.7%
    • Households spending >50% of income on housing: 18.1%
    • Poor mental health days: 17.8%
    • Life expectancy (years): 82
    • Percent of adults getting exercise: 81.2%
    • Population with health insurance: 98.1%
    • Marriage rate: 63.8%
    • Traffic volume per meter: 683
    • Access to activity space: 99.6%
    • Overcrowded households: 7.7%
    1. San Jose, CA
    • Households earning $100k+: 64.2%
    • Poverty rate: 8.1%
    • Households spending >50% of income on housing: 15.7%
    • Poor mental health days: 15%
    • Life expectancy (years): 83.8
    • Percent of adults getting exercise: 80.9%
    • Population with health insurance: 95.6%
    • Marriage rate: 48.6%
    • Traffic volume per meter: 626.4
    • Access to activity space: 99.4%
    • Overcrowded households: 7.9%
    1. Seattle, WA
    • Households earning $100k+: 57.1%
    • Poverty rate: 9.4%
    • Households spending >50% of income on housing: 15%
    • Poor mental health days: 16.6%
    • Life expectancy (years): 81.1
    • Percent of adults getting exercise: 86.7%
    • Population with health insurance: 96.3%
    • Marriage rate: 39.5%
    • Traffic volume per meter: 333
    • Access to activity space: 97.9%
    • Overcrowded households: 3.9%
    1. Raleigh, NC
    • Households earning $100k+: 43%
    • Poverty rate: 13.3%
    • Households spending >50% of income on housing: 12%
    • Poor mental health days: 15.7%
    • Life expectancy (years): 81
    • Percent of adults getting exercise: 84.2%
    • Population with health insurance: 92.9%
    • Marriage rate: 38.8%
    • Traffic volume per meter: 111.6
    • Access to activity space: 98.6%
    • Overcrowded households: 2%
    1. Boise, ID
    • Households earning $100k+: 39.9%
    • Poverty rate: 12.9%
    • Households spending >50% of income on housing: 10.9%
    • Poor mental health days: 17.1%
    • Life expectancy (years): 79.7
    • Percent of adults getting exercise: 82.4%
    • Population with health insurance: 93.1%
    • Marriage rate: 44.2%
    • Traffic volume per meter: 116.7
    • Access to activity space: 91.6%
    • Overcrowded households: 1.9%
    1. Lincoln, NE
    • Households earning $100k+: 33.5%
    • Poverty rate: 13.4%
    • Households spending >50% of income on housing: 12.6%
    • Poor mental health days: 15.3%
    • Life expectancy (years): 79.1
    • Percent of adults getting exercise: 78.9%
    • Population with health insurance: 93.4%
    • Marriage rate: 47%
    • Traffic volume per meter: 211.1
    • Access to activity space: 95.4%
    • Overcrowded households: 2.2%
    1. Anchorage, AK
    • Households earning $100k+: 53.9%
    • Poverty rate: 8.3%
    • Households spending >50% of income on housing: 13.2%
    • Poor mental health days: 16.3%
    • Life expectancy (years): 76.3
    • Percent of adults getting exercise: 80.1%
    • Population with health insurance: 90.6%
    • Marriage rate: 48.7%
    • Traffic volume per meter: 152.3
    • Access to activity space: 93.9%
    • Overcrowded households: 4.5%
    1. San Francisco, CA
    • Households earning $100k+: 61%
    • Poverty rate: 11.3%
    • Households spending >50% of income on housing: 16.9%
    • Poor mental health days: 16.6%
    • Life expectancy (years): 82.4
    • Percent of adults getting exercise: 83.6%
    • Population with health insurance: 97.2%
    • Marriage rate: 39.1%
    • Traffic volume per meter: 794
    • Access to activity space: 100%
    • Overcrowded households: 6.8%
    1. Minneapolis, MN
    • Households earning $100k+: 40.3%
    • Poverty rate: 15.1%
    • Households spending >50% of income on housing: 13.4%
    • Poor mental health days: 16.1%
    • Life expectancy (years): 79.5
    • Percent of adults getting exercise: 83.3%
    • Population with health insurance: 94.3%
    • Marriage rate: 34%
    • Traffic volume per meter: 304.6
    • Access to activity space: 99.1%
    • Overcrowded households: 2.7%
    1. Colorado Springs, CO
    • Households earning $100k+: 41.6%
    • Poverty rate: 8.8%
    • Households spending >50% of income on housing: 14.4%
    • Poor mental health days: 18.4%
    • Life expectancy (years): 76.2
    • Percent of adults getting exercise: 81.5%
    • Population with health insurance: 91.5%
    • Marriage rate: 52.6%
    • Traffic volume per meter: 140.9
    • Access to activity space: 89.8%
    • Overcrowded households: 2.5%
    1. Aurora, CO
    • Households earning $100k+: 46.4%
    • Poverty rate: 10.7%
    • Households spending >50% of income on housing: 15.6%
    • Poor mental health days: 17.1%
    • Life expectancy (years): 79.1
    • Percent of adults getting exercise: 82.4%
    • Population with health insurance: 85.6%
    • Marriage rate: 44.9%
    • Traffic volume per meter: 215.2
    • Access to activity space: 97.5%
    • Overcrowded households: 3%
    1. Charlotte, NC
    • Households earning $100k+: 43.7%
    • Poverty rate: 11.9%
    • Households spending >50% of income on housing: 14.3%
    • Poor mental health days: 16.3%
    • Life expectancy (years): 78.8
    • Percent of adults getting exercise: 81.1%
    • Population with health insurance: 87.9%
    • Marriage rate: 40.4%
    • Traffic volume per meter: 165.5
    • Access to activity space: 88.7%
    • Overcrowded households: 2.3%
    1. Omaha, NE
    • Households earning $100k+: 35.5%
    • Poverty rate: 14.2%
    • Households spending >50% of income on housing: 13.1%
    • Poor mental health days: 15.9%
    • Life expectancy (years): 77.7
    • Percent of adults getting exercise: 75.7%
    • Population with health insurance: 91.2%
    • Marriage rate: 44.3%
    • Traffic volume per meter: 214.9
    • Access to activity space: 97.4%
    • Overcrowded households: 2.1%
    1. Chula Vista, CA
    • Households earning $100k+: 52%
    • Poverty rate: 9.6%
    • Households spending >50% of income on housing: 20.8%
    • Poor mental health days: 17.3%
    • Life expectancy (years): 80.3
    • Percent of adults getting exercise: 81.7%
    • Population with health insurance: 94.8%
    • Marriage rate: 50.2%
    • Traffic volume per meter: 440.1
    • Access to activity space: 97.5%
    • Overcrowded households: 6.9%
    1. Honolulu, HI
    • Households earning $100k+: 44.5%
    • Poverty rate: 10.5%
    • Households spending >50% of income on housing: 19.4%
    • Poor mental health days: 14.8%
    • Life expectancy (years): 81.7
    • Percent of adults getting exercise: 77.8%
    • Population with health insurance: 96.8%
    • Marriage rate: 45.1%
    • Traffic volume per meter: 536.2
    • Access to activity space: 96.6%
    • Overcrowded households: 8.7%
    1. San Diego, CA
    • Households earning $100k+: 55.3%
    • Poverty rate: 10.4%
    • Households spending >50% of income on housing: 20.8%
    • Poor mental health days: 17.3%
    • Life expectancy (years): 80.3
    • Percent of adults getting exercise: 81.7%
    • Population with health insurance: 94.3%
    • Marriage rate: 43.9%
    • Traffic volume per meter: 440.1
    • Access to activity space: 97.5%
    • Overcrowded households: 6.9%
    1. Lexington, KY
    • Households earning $100k+: 34.2%
    • Poverty rate: 12.1%
    • Households spending >50% of income on housing: 14.7%
    • Poor mental health days: 17.4%
    • Life expectancy (years): 76.7
    • Percent of adults getting exercise: 77.1%
    • Population with health insurance: 91.9%
    • Marriage rate: 42.5%
    • Traffic volume per meter: 163.7
    • Access to activity space: 97.4%
    • Overcrowded households: 2.2%
    1. Mesa, AZ
    • Households earning $100k+: 41.9%
    • Poverty rate: 10.8%
    • Households spending >50% of income on housing: 14.2%
    • Poor mental health days: 18.2%
    • Life expectancy (years): 77.5
    • Percent of adults getting exercise: 78%
    • Population with health insurance: 89%
    • Marriage rate: 48.5%
    • Traffic volume per meter: 244.2
    • Access to activity space: 92.8%
    • Overcrowded households: 4.4%
    1. Pittsburgh, PA
    • Households earning $100k+: 33.2%
    • Poverty rate: 20.1%
    • Households spending >50% of income on housing: 11.9%
    • Poor mental health days: 17.9%
    • Life expectancy (years): 76.9
    • Percent of adults getting exercise: 79%
    • Population with health insurance: 96%
    • Marriage rate: 33.6%
    • Traffic volume per meter: 202.3
    • Access to activity space: 93.3%
    • Overcrowded households: 0.9%
    1. Denver, CO
    • Households earning $100k+: 46.8%
    • Poverty rate: 12.1%
    • Households spending >50% of income on housing: 16.3%
    • Poor mental health days: 18.3%
    • Life expectancy (years): 77.4
    • Percent of adults getting exercise: 78.8%
    • Population with health insurance: 90.7%
    • Marriage rate: 40.5%
    • Traffic volume per meter: 415.7
    • Access to activity space: 99.1%
    • Overcrowded households: 3.1%
    1. Oakland, CA
    • Households earning $100k+: 51.2%
    • Poverty rate: 11.9%
    • Households spending >50% of income on housing: 18.1%
    • Poor mental health days: 17.8%
    • Life expectancy (years): 82
    • Percent of adults getting exercise: 81.2%
    • Population with health insurance: 94.1%
    • Marriage rate: 38.3%
    • Traffic volume per meter: 683
    • Access to activity space: 99.6%
    • Overcrowded households: 7.7%
    1. Spokane, WA
    • Households earning $100k+: 38.4%
    • Poverty rate: 12.7%
    • Households spending >50% of income on housing: 13.9%
    • Poor mental health days: 19.9%
    • Life expectancy (years): 76.9
    • Percent of adults getting exercise: 79.6%
    • Population with health insurance: 93.7%
    • Marriage rate: 41.9%
    • Traffic volume per meter: 150.4
    • Access to activity space: 87.6%
    • Overcrowded households: 2.1%
    1. Atlanta, GA
    • Households earning $100k+: 45.4%
    • Poverty rate: 15.8%
    • Households spending >50% of income on housing: 17.3%
    • Poor mental health days: 15.9%
    • Life expectancy (years): 77.5
    • Percent of adults getting exercise: 80%
    • Population with health insurance: 91.4%
    • Marriage rate: 31.8%
    • Traffic volume per meter: 384
    • Access to activity space: 93.8%
    • Overcrowded households: 2%
    1. Henderson, NV
    • Households earning $100k+: 48.3%
    • Poverty rate: 8.8%
    • Households spending >50% of income on housing: 18.5%
    • Poor mental health days: 18.4%
    • Life expectancy (years): 76.6
    • Percent of adults getting exercise: 73%
    • Population with health insurance: 94.2%
    • Marriage rate: 48%
    • Traffic volume per meter: 196.6
    • Access to activity space: 95.7%
    • Overcrowded households: 4.4%

    Data and Methodology

    Eighty-five of the largest U.S. cities for which data was available were evaluated across three categories: personal finance, well-being, and quality of life. Data comes from the U.S. Census Bureau 1-Year American Community Survey for 2024 and the County Health Rankings & Roadmaps for 2025.

    Personal finance metrics included:

    • Percent of individuals earning $100,000 or more.
    • Percent of households that spend 50% or more of their income on housing.
    • Percent of residents below the poverty level.

    Well-being metrics include:

    • Average percentage of days spent with poor mental health
    • Life expectancy in years.
    • Percentage of residents getting exercise.
    • Percentage of residents who have health insurance.

    Quality of life metrics include:

    • Marriage rate.
    • Average traffic volume per meter of major roadways in the county.
    • Percentage of population with adequate access to locations for physical activity.
    • Percentage of households with overcrowding, defined as more than one person living in a room.

    This story was produced by SmartAsset and reviewed and distributed by Stacker.

  • A millionaire swapped lives with a struggling family for a week on a $230 budget. The money wasn’t what broke him.
    Photo credit: CanvaDepressed man looks at his laptop.

    Matt Fiddes runs a multi-million dollar martial arts franchise in Britain. His family’s weekly budget runs around $2,058. He’d never really looked at a price tag before buying something.

    For a social experiment documented by the YouTube channel Only Human, the Fiddes family swapped lives with the Leamons (Andy, Kim, their two kids, and two dogs) who get by on $230 a week. Kim had a life-saving surgery after an accident and now lives with Chronic Regional Pain Syndrome. They lost their savings. Andy works alone to support the family.

    On day one of the swap, Matt learned his weekly budget was $230. “That basically fills up the fuel tank of my car,” he said.

    wealth inequality, poverty, social experiment, class, viral video
    A man calculating his budget on his laptop. Photo credit: Canva

    What followed was a week of grocery bills he had to think about, a neighborhood with nothing much in it, and night shifts, something he’d never worked in his life. His wife Moniqe cried when she heard about Kim’s condition from the Leamons’ friends.

    By the end of the week, Matt had something to say that was harder to shrug off than the budget: “I feel guilty; no one should live like this.”

    He also said the week brought his family closer together. The Fiddes left a gift behind for the Leamons when they returned home: a mobility scooter for Kim, so she could get around on her own.

    The Leamons, meanwhile, spent the week in the Fiddes’ house taking their kids to a theme park and doing a little shopping experiencing, briefly, what it feels like when money isn’t a constant calculation.

    One YouTube commenter put it plainly: “I feel this was a much-needed vacation for the poor family and a grounding experience for the rich family.” That’s about right.

    You can watch the full documentary here:

Explore More Everyday Economics Stories

Everyday Economics

The happiest cities in America in 2026, ranked across 11 factors

Money

A millionaire swapped lives with a struggling family for a week on a $230 budget. The money wasn’t what broke him.

Everyday Economics

Illustrator says the best way to stay motivated when learning a new hobby is to spend money

Everyday Economics

Driver breaks down how much he makes from Uber, enraging both drivers and passengers