It’s 2050, and global warming is in full effect. Because of regional climate disruptions, crops that once were abundant no longer grow in their original habitat. Drought has demolished Africa’s once-fertile farmlands, and monsoons have drowned East Asia’s rice supply. The world’s agricultural infrastructure is in complete disarray.The possibility of such a catastrophe, however remote, has led the Global Crop Diversity Trust, a small nonprofit based in Rome, to create the Svalbard International Seed Vault. This new air-locked structure, soon to be dug into an arctic mountainside on Norway’s Spitsbergen Island, ensures the long-term survival of the world’s agriculture by preserving one of its most basic resources: seeds. “The vault is a global insurance policy,” says Cary Fowler, the executive secretary of the Trust, the organization spearheading the comprehensive archive. Funded with $3 million from the Norwegian government, the vault will safeguard seeds of every known crop variety from nearly every country on earth, and will begin accepting samples in fall 2007.Protected from any mischief by an intricate system of motion detectors and alarms, the vault is also secured by the island’s permafrost, which, despite global warming, should guarantee that the temperature inside the vault rises no higher than 27 degrees Fahrenheit in the event of refrigeration equipment malfunction. “It is, in a sense, made to run by itself,” says Fowler. Currently under construction, the vault will resemble a library, with shelves of sealed boxes that each hold up to 400 different samples, preserving them for hundreds of years.”Crop diversity is the most precious resource on earth,” says Fowler. “It allows us to fashion efficient and sustainable responses to food insecurity, climate change, and constraints in water and energy supplies.” He explains that extinction is a process, not an event. “It doesn’t take place when the last individual dies, but when the species loses the ability to evolve. We must realize that our major crops can become extinct even if there are presently billions of that species. They are domesticated plants. Their evolution is in our hands.” And soon, safe in a vault.FOUND Dutch explorer Willem Barents discovered Spitsbergen, the largest island in the Svalbard Archipelago, while searching for the Northern Sea Route in 1596.LEARN MORE croptrust.org
Tags
advertisement
More for You
-
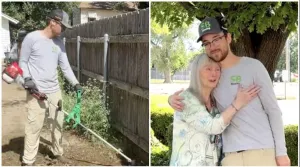
Man’s dog suddenly becomes protective of his wife, Internet clocks the reason right away
The online community came through in a big way.
Reddit user Girlfriendhatesmefor’s three-year-old pitbull, Otis, had recently become overprotective of his wife. So he asked the online community if they knew what might be wrong with the dog.
“A week or two ago, my wife got some sort of stomach bug,” the Reddit user wrote under the subreddit /r/dogs. “She was really nauseous and ill for about a week. Otis is very in tune with her emotions (we once got in a fight and she was upset, I swear he was staring daggers at me lol) and during this time didn’t even want to leave her to go on walks. We thought it was adorable!”
His wife soon felt better, butthe dog’s behavior didn’t change.
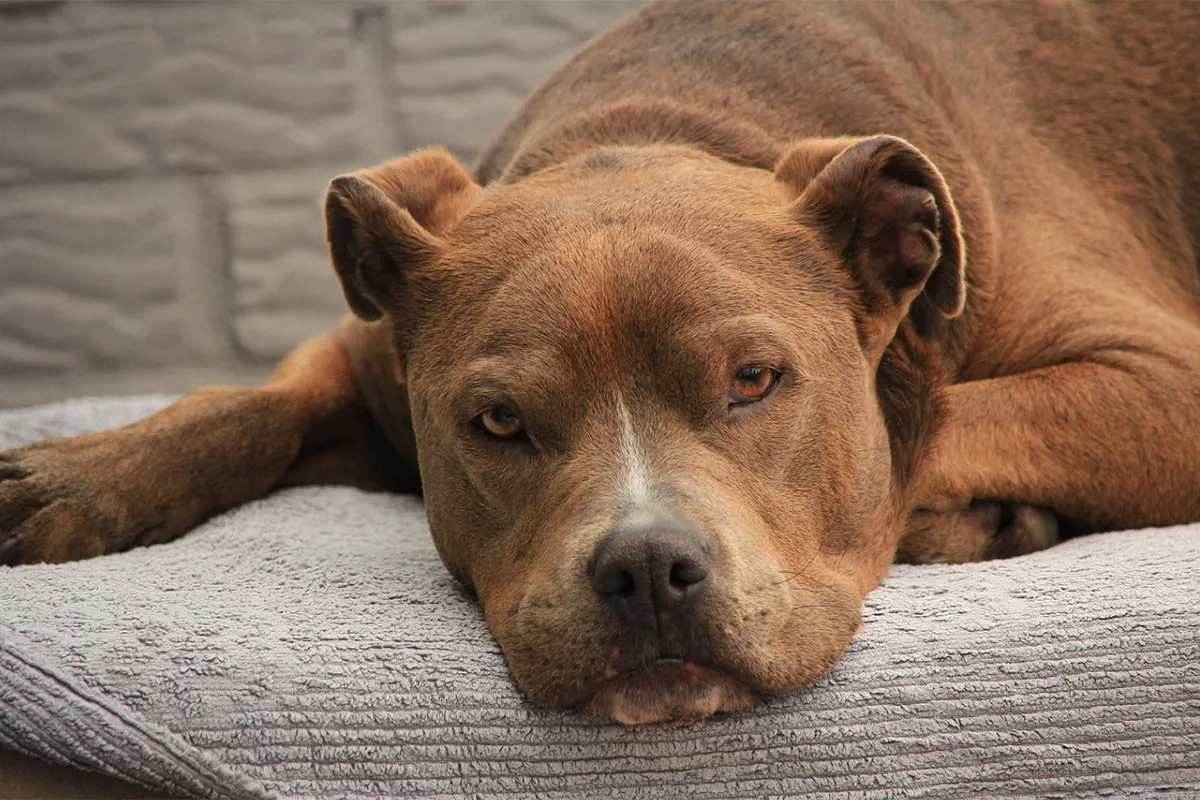
Otis knew before they did. Canva Girlfriendhatesmefor began to fear that Otis’ behavior may be an early sign of an aggression issue or an indication that the dog was hurt or sick.
So he threw a question out to fellow Reddit users: “Has anyone else’s dog suddenly developed attachment/aggression issues? Any and all advice appreciated, even if it’s that we’re being paranoid!”
The most popular response to his thread was by ZZBC.
Any chance your wife is pregnant?
ZZBC | Reddit
The potential news hit Girlfriendhatesmefor like a ton of bricks. A few days later, Girlfriendhatesmefor posted an update and ZZBC was right!
“The wifey is pregnant!” the father-to-be wrote. “Otis is still being overprotective but it all makes sense now! Thanks for all the advice and kind words! Sorry for the delayed reply, I didn’t check back until just now!”
Redditors responded with similar experiences.
Anecdotal I know but I swear my dog knew I was pregnant before I was. He was super clingy (more than normal) and was always resting his head on my belly.
realityisworse | Reddit
So why do dogs get overprotective when someone is pregnant?
Jeff Werber, PhD, president and chief veterinarian of the Century Veterinary Group in Los Angeles, told Health.com that “dogs can also smell the hormonal changes going on in a woman’s body at that time.” He added the dog may “not understand that this new scent of your skin and breath is caused by a developing baby, but they will know that something is different with you—which might cause them to be more curious or attentive.”
The big lesson here is to listen to your pets and to ask questions when their behavior abruptly changes. They may be trying to tell you something, and the news may be life-changing.
This article originally appeared last year.
-
14 images of badass women who destroyed stereotypes and inspired future generations
These trailblazers redefined what a woman could be.
Throughout history, women have stood up and fought to break down barriers imposed on them from stereotypes and societal expectations. The trailblazers in these photos made history and redefined what a woman could be. In doing so, they paved the way for future generations to stand up and continue to fight for equality.
-
Why mass shootings spawn conspiracy theories
Mass shootings and conspiracy theories have a long history.
While conspiracy theories are not limited to any topic, there is one type of event that seems particularly likely to spark them: mass shootings, typically defined as attacks in which a shooter kills at least four other people.
When one person kills many others in a single incident, particularly when it seems random, people naturally seek out answers for why the tragedy happened. After all, if a mass shooting is random, anyone can be a target.
Pointing to some nefarious plan by a powerful group – such as the government – can be more comforting than the idea that the attack was the result of a disturbed or mentally ill individual who obtained a firearm legally.

advertisement