Last winter, the frigid waters of the Southern Ocean Sanctuary, an area of the Antarctic Ocean where whaling is strictly prohibited, were patrolled by the 180-foot, 657-ton ice-class Farley Mowat, flagship of the Sea Shepherd Conservation Society. In one daring encounter, the Mowat rammed a Japanese whaler and chased it from the sanctuary. This year, the Mowat and a second ship, the Robert Hunter, have embarked on Operation Leviathan, to once again prevent a Japanese whaling fleet from hunting and killing whales (ostensibly for scientific research) in those same protected waters. “Our objective,” explains Paul Watson, the 56-year-old SSCS founder and Greenpeace co-founder, “is not to get there, hold up banners and say, ‘Oh please, please stop whaling.’ Our objective is to shut them down by physically blocking and intervening.”Operation Leviathan is the latest in a long line of SSCS campaigns wherein the anti-whaling activists do everything in their power to prevent the illegal hunting of whales in protected waters. Their tactics range from putting themselves between the hunters and the whales, to physically jamming whalers’ propellers with debris. If all else fails, SSCS ships will ram the offending vessel. Since 1979, the SSCS has taken 215 voyages, during which time it has also sabotaged and sunk 11 unoccupied docked whaling ships.Actions such as these have resulted in awards and accolades for the SSCS, but the organization has also garnered serious criticism from the Japanese whaling industry and members of the International Whaling Commission, who have equated SSCS policies with terrorism. But Watson, who left Greenpeace in 1977 when he felt that bureaucracy was hampering the work, insists that the brazen tactics of the SSCS are supported by the 1982 U.N. World Charter for Nature, which permits individual enforcement of international conservation laws. “The fact is that we don’t break laws, we uphold them,” Watson says, “and we will never abandon our campaigns.”LEARN MORE seashepherd.org
Tags
advertisement
More for You
-
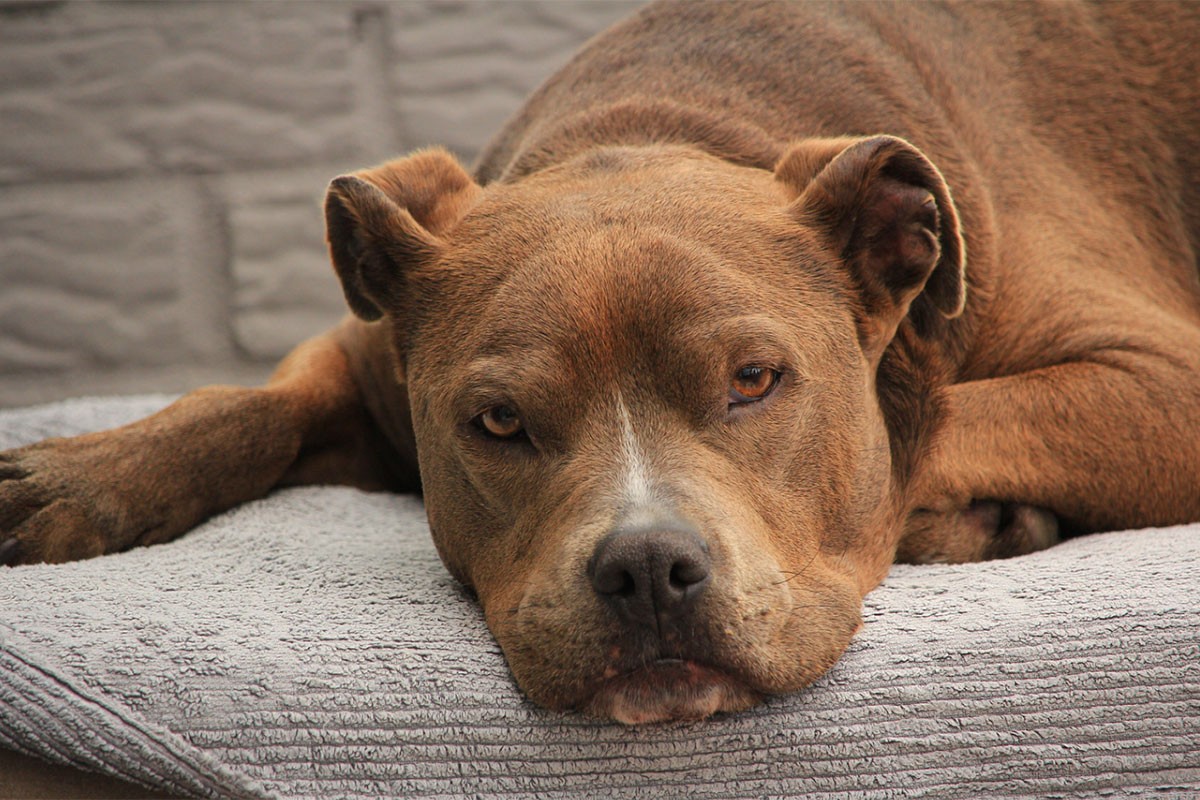
Man’s dog suddenly becomes protective of his wife, Internet clocks the reason right away
The online community came through in a big way.
Reddit user Girlfriendhatesmefor’s three-year-old pitbull, Otis, had recently become overprotective of his wife. So he asked the online community if they knew what might be wrong with the dog.
“A week or two ago, my wife got some sort of stomach bug,” the Reddit user wrote under the subreddit /r/dogs. “She was really nauseous and ill for about a week. Otis is very in tune with her emotions (we once got in a fight and she was upset, I swear he was staring daggers at me lol) and during this time didn’t even want to leave her to go on walks. We thought it was adorable!”
His wife soon felt better, butthe dog’s behavior didn’t change.
Otis knew before they did. Canva Girlfriendhatesmefor began to fear that Otis’ behavior may be an early sign of an aggression issue or an indication that the dog was hurt or sick.
So he threw a question out to fellow Reddit users: “Has anyone else’s dog suddenly developed attachment/aggression issues? Any and all advice appreciated, even if it’s that we’re being paranoid!”
The most popular response to his thread was by ZZBC.
Any chance your wife is pregnant?
ZZBC | Reddit
The potential news hit Girlfriendhatesmefor like a ton of bricks. A few days later, Girlfriendhatesmefor posted an update and ZZBC was right!
“The wifey is pregnant!” the father-to-be wrote. “Otis is still being overprotective but it all makes sense now! Thanks for all the advice and kind words! Sorry for the delayed reply, I didn’t check back until just now!”
Redditors responded with similar experiences.
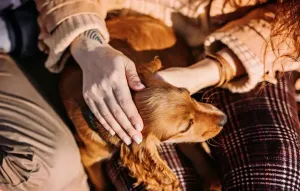
Anecdotal I know but I swear my dog knew I was pregnant before I was. He was super clingy (more than normal) and was always resting his head on my belly.
realityisworse | Reddit
So why do dogs get overprotective when someone is pregnant?
Jeff Werber, PhD, president and chief veterinarian of the Century Veterinary Group in Los Angeles, told Health.com that “dogs can also smell the hormonal changes going on in a woman’s body at that time.” He added the dog may “not understand that this new scent of your skin and breath is caused by a developing baby, but they will know that something is different with you—which might cause them to be more curious or attentive.”
The big lesson here is to listen to your pets and to ask questions when their behavior abruptly changes. They may be trying to tell you something, and the news may be life-changing.
This article originally appeared last year.
-
14 images of badass women who destroyed stereotypes and inspired future generations
These trailblazers redefined what a woman could be.
Throughout history, women have stood up and fought to break down barriers imposed on them from stereotypes and societal expectations. The trailblazers in these photos made history and redefined what a woman could be. In doing so, they paved the way for future generations to stand up and continue to fight for equality.
-
Why mass shootings spawn conspiracy theories
Mass shootings and conspiracy theories have a long history.
While conspiracy theories are not limited to any topic, there is one type of event that seems particularly likely to spark them: mass shootings, typically defined as attacks in which a shooter kills at least four other people.
When one person kills many others in a single incident, particularly when it seems random, people naturally seek out answers for why the tragedy happened. After all, if a mass shooting is random, anyone can be a target.
Pointing to some nefarious plan by a powerful group – such as the government – can be more comforting than the idea that the attack was the result of a disturbed or mentally ill individual who obtained a firearm legally.

advertisement


Sign Up for the Daily Good!
Advertisement
