When a woman combined the wisdom of “Ask and you shall receive” with the saying, “Mama knows best,” the outcome was extraordinary. As a result, she received a remarkable offer – a full scholarship to law school, which has a value of up to $300,000! TikTok user Jayda (@jaydapeets) captioned her viral video, “The call that saved me nearly $300,000, need to do a storytime.” The video depicts her mother sitting in a coffee shop, silently mimicking the words of a voiceover of Kris Jenner asking, “What would happen if you just call Taylor up?” Originating from a season 12 episode of “Keeping Up With the Kardashians,” Jenner delivered the iconic catchphrase to Kim Kardashian, referring to the controversy surrounding the Taylor Swift and Kanye West song “Famous.” The voiceover gained widespread popularity on TikTok, prompting numerous users to create parodies showcasing the most absurd suggestions their parents have made. The trend spread rapidly across the platform, capturing the humorous and imaginative nature of parents’ advice.

Image Source: TikTok/@jaydapeets

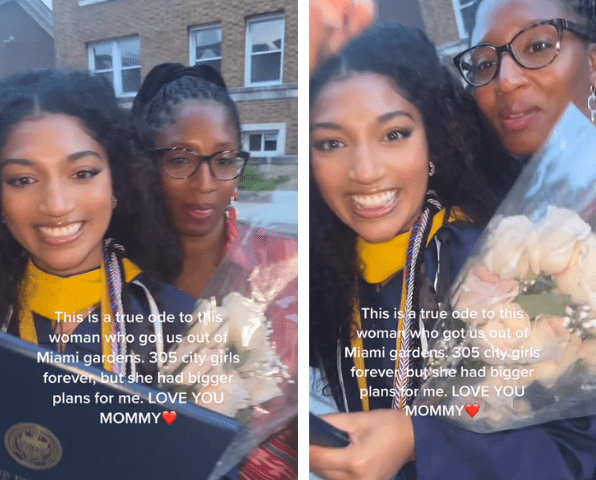
In the TikTok video, Jayda shared her mother’s advice through a text overlay. The message read, “When my mom told me to literally just call the dean of my law school and ask for a full-ride scholarship.” In contrast to other TikTokers who considered their parent’s advice unrealistic or far-fetched, Jayda’s mom’s suggestion was quite remarkable. Astonishingly, the dean of admissions responded positively. Jayda said, “She actually said yes.”


via GIPHY


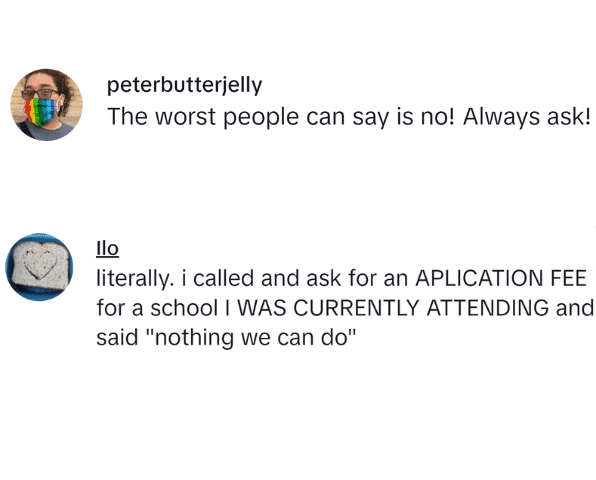
A 2020 survey conducted by the American Bar Association Young Lawyers Division and AccessLex Institute revealed that around 50% of law school graduates are burdened with student loan debts exceeding $160,000. As of Wednesday, Jayda’s video had garnered over 1.1 million views, generating a significant response from viewers. The post received numerous shocked comments, reflecting the widespread astonishment at Jayda’s remarkable achievement.

Image Source: TikTok/@jaydapeets

Image Source: TikTok/@peter.butter.jelly, TikTok/@.ilo00

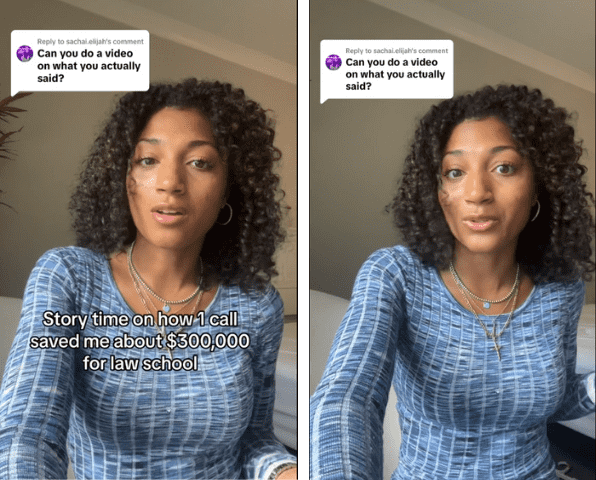
Due to many queries regarding her achievement, she shared the whole story in a subsequent video dedicated solely to a storytime format. She explained that the scholarship offer was more complex than a phone call. She mentioned that she had visited the school on multiple occasions, even organizing a trip for 15 individuals, allowing her to establish connections with the admissions office staff. She explained how her previous experience had paid off. “They were able to see my work ethic beforehand and just get my personality.” Jayda then revealed that she discovered a relatively unknown scholarship. “The scholarship is tucked away on the internet. Unless you’re looking for it, you won’t find it.” Leveraging her understanding of the scholarship and the strong connections she had built with the admission office, she made a compelling case for herself to be considered for the opportunity.

Image Source: TikTok/@jaydapeets

After being admitted to the university, Jayda hoped that she would receive the scholarship. However, as weeks passed without any offer, she reached out to her mom in tears. Her mom advised her to call the dean directly. She recalls in the video, “I thought that was crazy, but whatever.” Jayda took a chance and made the call one afternoon. Although the dean seemed uncertain during the conversation, she promised to call Jayda back in 5 minutes. To Jayda’s surprise, the dean called back with incredible news. Thanks to Jayda’s networking efforts and impressive GPA, the dean offered her a life-changing law school scholarship.

Shows what you can achieve if you just listen to your mother!

  • 8 ways to squeeze more miles from every tank, according to America’s fleet pros
    Man inflating car tires at a gas station.

    Kelly Soderlund for Samsara

    The trucking industry has turned fuel efficiency into a science. Here’s what everyday drivers can borrow from their playbook.

    Diesel hit $5.03 per gallon for U.S. commercial fleets in early 2026 — and fuel already eats up roughly 21–24% of what motor carriers spend just to operate. That financial pressure turned fuel management into one of the most carefully engineered problems in the trucking industry. Fleet operators have cameras, sensors, and software all pointed at one question: How do you stop wasting fuel?

    The answers they’ve landed on aren’t mysterious or trucking-specific. Most of them apply just as well to a Honda Civic as to an 18-wheeler. Samsara shares eight things the pros do that you can start doing today.

    1. Stop idling. Seriously.

    This one sounds obvious until you add up how often you actually do it. Sitting in a drive-through, waiting for someone outside a building, letting the car “warm up” before a winter drive — it all adds up. Commercial trucks burn close to a gallon of fuel per hour while idling, and the widely held belief that idling is easier on an engine than restarting is flat-out wrong. Restarting costs less.

    Fleet companies track idling per driver and flag anything that looks excessive. At home, the rule of thumb is simple: If you’re stopped for more than a minute and going nowhere, shut it off.

    2. Drive like you’re trying to protect a full cup of coffee on the dashboard.

    The way you use your right foot is probably the single biggest variable in your fuel economy. Hard acceleration, speeding, and aggressive braking can reduce fuel efficiency by as much as 40%, according to the U.S. Department of Energy. That’s nearly half your gas budget.

    Commercial fleets coach their drivers specifically on smooth throttle inputs: gradual acceleration, cruise control on highways, and coasting into stops instead of braking late and hard. The physics don’t care what size vehicle you’re driving.

    3. Pay attention to your own numbers.

    One discovery from the fleet world: When you show drivers their own efficiency scores, they improve without being told to. Companies that introduced driver performance dashboards and friendly competition between drivers saw measurable gains — one fleet tracked a jump from 6 MPG to 7.5 MPG after making individual scores visible.

    Most cars already give you this data. If yours has a fuel economy display, watch it. If you want to go further, note your mileage at each fill-up and calculate your MPG manually. Setting a personal monthly target and trying to beat it month over month is genuinely effective, mostly because awareness changes behavior.

    4. Think like a dispatcher when you plan your errands.

    The cheapest gallon of fuel is the one you never have to buy. Commercial dispatchers obsess over route efficiency because unnecessary miles are pure cost with no upside. That logic applies in your driveway, too.

    Before you run errands, spend 90 seconds thinking about the most logical order — fewest backtracks, least highway-to-city switching, combining stops you’d otherwise make on separate days. Apps like Google Maps and Waze handle the turn-by-turn, but the trip consolidation decision is yours to make before you leave.

    5. Find cheaper gas before you’re running on empty.

    Fuel prices can vary by 30 cents or more per gallon within just a few miles. Fleet operators now route drivers toward lower-cost fuel stops using real-time price data. You can do the exact same thing with GasBuddy, Waze’s gas prices layer, or the gas station search in Google Maps, which pulls in nearby prices.

    The habit that makes this work: Check prices before your tank is low, not after. Desperation-fueling — stopping at whatever’s convenient when the warning light is on — is reliably the most expensive way to fill up.

    6. Watch for fraud at the pump.

    This is less about efficiency and more about not losing money you didn’t know you were losing. Fuel theft and card skimming at gas stations are more common than most drivers realize, and fraudulent charges from a compromised card often go unnoticed for weeks. Fleet companies use real-time transaction alerts to flag unusual purchases immediately.

    For personal use, a few practical habits help: Use tap-to-pay instead of swiping when the terminal allows it (skimming devices can’t read contactless transactions), check your bank and credit card statements weekly, and consider a card with real-time transaction notifications turned on.

    7. Your tire pressure is costing you money right now.

    Here’s a number that tends to surprise people: For every 1 PSI drop in tire pressure, your vehicle loses roughly 0.4% of its fuel efficiency. Tires lose pressure slowly and steadily — a few PSI over a few months is completely normal and easy to miss. By the time you notice a tire looks low, it’s been costing you at the pump for weeks.

    Fleet maintenance teams tie tire pressure checks directly to fuel economy because the correlation is consistent and measurable. For personal vehicles, checking tire pressure once a month takes about five minutes. While you’re at it, a clogged air filter, old engine oil, or worn spark plugs all carry similar slow-drain effects on efficiency that a routine tune-up addresses.

    8. Track your MPG over time — and notice when it changes.

    Fleets benchmark fuel performance across their vehicles and flag outliers: a truck getting meaningfully fewer miles per gallon than similar trucks is likely developing a mechanical problem before it becomes a breakdown. The fuel data is an early warning signal.

    Your car works the same way. If you track your MPG over several fill-ups and see a notable drop without a change in how or where you’re driving, something is usually going on mechanically. Catching it at the “slightly worse MPG” stage is almost always cheaper than catching it at the “broken down on the highway” stage.

    Fuel cost analysis and fleet efficiency data referenced in this article are drawn from Samsara’s research on commercial fleet fuel management.

    This story was produced by Samsara and reviewed and distributed by Stacker.

  • The happiest cities in America in 2026, ranked across 11 factors
    A sunrise view of a row of cherry blossom trees and the Rosslyn skyline reflected in the Tidal Basin in Virginia.
    ,

    The happiest cities in America in 2026, ranked across 11 factors

    Arlington leads a data-driven look at where Americans may be happiest.

    Jaclyn DeJohn, CFP for SmartAsset

    Happiness may not be easy to quantify, but some qualifiers may make a person more likely to feel satisfied in life. A reasonable degree of financial freedom can alleviate worry about day-to-day costs and the occasional unexpected expense. Similarly, good relationships, overall health and longevity, basic conveniences, and privacy can go a long way in keeping stress down and contentment up. While none of these things alone are the secret to happiness, they may all individually contribute to a life geared toward wants rather than needs — freeing up time and resources for individuals to explore and build a life on their own terms.

    With this in mind, SmartAsset ranked 85 of the largest U.S. cities with available data based on 11 happiness factors spanning personal finance, physical and mental well-being, and quality of life factors.

    Key Findings

    • Arlington, VA, ranks as the happiest city for 2026. Arlington ranks among the top five cities for a variety of happiness metrics, including life expectancy (83.9 years), household earnings over $100,000 (64.3%), mentally healthy days (84.9%), adults getting exercise (83%), and access to activity spaces (100%).
    • Fremont, CA, households outearn their peers. Ranking second overall for happiest cities, 70.7% of Fremont households earn over $100,000, the most studywide. This pairs with the lowest poverty rate of 4.7%. However, 18.1% of households in Fremont end up spending 50% or more of their income on housing. In tandem, the population maintains the highest rate of health insurance coverage and marriage, at 98.1% and 63.8%, respectively.
    • Austin, TX, has the least traffic. The traffic volume per meter in Austin, Texas — a practice ground for many autonomous vehicle companies — is lowest studywide at 42.1. This pales in comparison to Boston, which has over 40 times the traffic volume per meter at 1753.9. The average traffic volume per meter is 299.
    • Residents have the most mentally healthy days in Honolulu. Ranking 16th happiest overall, Honolulu residents feel mentally healthy for 85.2% of days. San Jose, California, follows closely at 85% mentally healthy days. On the other end of the spectrum, the residents of Toledo, Ohio, have the worst mental health ranking, at 78.2% of days spent mentally healthy.
    • These California cities have the most overcrowding in housing. Privacy and space can go a long way in making a person comfortable in their own space, and can be indicative of financial resources. In Long Beach, Los Angeles, and Fresno, just over 10% of households are home to more than one person per bedroom. Laredo, Texas, also falls into this category of high overcrowding. Meanwhile, Pittsburgh has the lowest rate of overcrowding at 0.9%.
    Table listing the top cities where Americans are happiest.

    Top 25 Happiest Cities

    1. Arlington, VA
    • Households earning $100k+: 64.3%
    • Poverty rate: 8.3%
    • Households spending >50% of income on housing: 14.2%
    • Poor mental health days: 15.1%
    • Life expectancy (years): 83.9
    • Percent of adults getting exercise: 83%
    • Population with health insurance: 93.9%
    • Marriage rate: 44.2%
    • Traffic volume per meter: 540
    • Access to activity space: 100%
    • Overcrowded households: 3.4%
    1. Fremont, CA
    • Households earning $100k+: 70.7%
    • Poverty rate: 4.7%
    • Households spending >50% of income on housing: 18.1%
    • Poor mental health days: 17.8%
    • Life expectancy (years): 82
    • Percent of adults getting exercise: 81.2%
    • Population with health insurance: 98.1%
    • Marriage rate: 63.8%
    • Traffic volume per meter: 683
    • Access to activity space: 99.6%
    • Overcrowded households: 7.7%
    1. San Jose, CA
    • Households earning $100k+: 64.2%
    • Poverty rate: 8.1%
    • Households spending >50% of income on housing: 15.7%
    • Poor mental health days: 15%
    • Life expectancy (years): 83.8
    • Percent of adults getting exercise: 80.9%
    • Population with health insurance: 95.6%
    • Marriage rate: 48.6%
    • Traffic volume per meter: 626.4
    • Access to activity space: 99.4%
    • Overcrowded households: 7.9%
    1. Seattle, WA
    • Households earning $100k+: 57.1%
    • Poverty rate: 9.4%
    • Households spending >50% of income on housing: 15%
    • Poor mental health days: 16.6%
    • Life expectancy (years): 81.1
    • Percent of adults getting exercise: 86.7%
    • Population with health insurance: 96.3%
    • Marriage rate: 39.5%
    • Traffic volume per meter: 333
    • Access to activity space: 97.9%
    • Overcrowded households: 3.9%
    1. Raleigh, NC
    • Households earning $100k+: 43%
    • Poverty rate: 13.3%
    • Households spending >50% of income on housing: 12%
    • Poor mental health days: 15.7%
    • Life expectancy (years): 81
    • Percent of adults getting exercise: 84.2%
    • Population with health insurance: 92.9%
    • Marriage rate: 38.8%
    • Traffic volume per meter: 111.6
    • Access to activity space: 98.6%
    • Overcrowded households: 2%
    1. Boise, ID
    • Households earning $100k+: 39.9%
    • Poverty rate: 12.9%
    • Households spending >50% of income on housing: 10.9%
    • Poor mental health days: 17.1%
    • Life expectancy (years): 79.7
    • Percent of adults getting exercise: 82.4%
    • Population with health insurance: 93.1%
    • Marriage rate: 44.2%
    • Traffic volume per meter: 116.7
    • Access to activity space: 91.6%
    • Overcrowded households: 1.9%
    1. Lincoln, NE
    • Households earning $100k+: 33.5%
    • Poverty rate: 13.4%
    • Households spending >50% of income on housing: 12.6%
    • Poor mental health days: 15.3%
    • Life expectancy (years): 79.1
    • Percent of adults getting exercise: 78.9%
    • Population with health insurance: 93.4%
    • Marriage rate: 47%
    • Traffic volume per meter: 211.1
    • Access to activity space: 95.4%
    • Overcrowded households: 2.2%
    1. Anchorage, AK
    • Households earning $100k+: 53.9%
    • Poverty rate: 8.3%
    • Households spending >50% of income on housing: 13.2%
    • Poor mental health days: 16.3%
    • Life expectancy (years): 76.3
    • Percent of adults getting exercise: 80.1%
    • Population with health insurance: 90.6%
    • Marriage rate: 48.7%
    • Traffic volume per meter: 152.3
    • Access to activity space: 93.9%
    • Overcrowded households: 4.5%
    1. San Francisco, CA
    • Households earning $100k+: 61%
    • Poverty rate: 11.3%
    • Households spending >50% of income on housing: 16.9%
    • Poor mental health days: 16.6%
    • Life expectancy (years): 82.4
    • Percent of adults getting exercise: 83.6%
    • Population with health insurance: 97.2%
    • Marriage rate: 39.1%
    • Traffic volume per meter: 794
    • Access to activity space: 100%
    • Overcrowded households: 6.8%
    1. Minneapolis, MN
    • Households earning $100k+: 40.3%
    • Poverty rate: 15.1%
    • Households spending >50% of income on housing: 13.4%
    • Poor mental health days: 16.1%
    • Life expectancy (years): 79.5
    • Percent of adults getting exercise: 83.3%
    • Population with health insurance: 94.3%
    • Marriage rate: 34%
    • Traffic volume per meter: 304.6
    • Access to activity space: 99.1%
    • Overcrowded households: 2.7%
    1. Colorado Springs, CO
    • Households earning $100k+: 41.6%
    • Poverty rate: 8.8%
    • Households spending >50% of income on housing: 14.4%
    • Poor mental health days: 18.4%
    • Life expectancy (years): 76.2
    • Percent of adults getting exercise: 81.5%
    • Population with health insurance: 91.5%
    • Marriage rate: 52.6%
    • Traffic volume per meter: 140.9
    • Access to activity space: 89.8%
    • Overcrowded households: 2.5%
    1. Aurora, CO
    • Households earning $100k+: 46.4%
    • Poverty rate: 10.7%
    • Households spending >50% of income on housing: 15.6%
    • Poor mental health days: 17.1%
    • Life expectancy (years): 79.1
    • Percent of adults getting exercise: 82.4%
    • Population with health insurance: 85.6%
    • Marriage rate: 44.9%
    • Traffic volume per meter: 215.2
    • Access to activity space: 97.5%
    • Overcrowded households: 3%
    1. Charlotte, NC
    • Households earning $100k+: 43.7%
    • Poverty rate: 11.9%
    • Households spending >50% of income on housing: 14.3%
    • Poor mental health days: 16.3%
    • Life expectancy (years): 78.8
    • Percent of adults getting exercise: 81.1%
    • Population with health insurance: 87.9%
    • Marriage rate: 40.4%
    • Traffic volume per meter: 165.5
    • Access to activity space: 88.7%
    • Overcrowded households: 2.3%
    1. Omaha, NE
    • Households earning $100k+: 35.5%
    • Poverty rate: 14.2%
    • Households spending >50% of income on housing: 13.1%
    • Poor mental health days: 15.9%
    • Life expectancy (years): 77.7
    • Percent of adults getting exercise: 75.7%
    • Population with health insurance: 91.2%
    • Marriage rate: 44.3%
    • Traffic volume per meter: 214.9
    • Access to activity space: 97.4%
    • Overcrowded households: 2.1%
    1. Chula Vista, CA
    • Households earning $100k+: 52%
    • Poverty rate: 9.6%
    • Households spending >50% of income on housing: 20.8%
    • Poor mental health days: 17.3%
    • Life expectancy (years): 80.3
    • Percent of adults getting exercise: 81.7%
    • Population with health insurance: 94.8%
    • Marriage rate: 50.2%
    • Traffic volume per meter: 440.1
    • Access to activity space: 97.5%
    • Overcrowded households: 6.9%
    1. Honolulu, HI
    • Households earning $100k+: 44.5%
    • Poverty rate: 10.5%
    • Households spending >50% of income on housing: 19.4%
    • Poor mental health days: 14.8%
    • Life expectancy (years): 81.7
    • Percent of adults getting exercise: 77.8%
    • Population with health insurance: 96.8%
    • Marriage rate: 45.1%
    • Traffic volume per meter: 536.2
    • Access to activity space: 96.6%
    • Overcrowded households: 8.7%
    1. San Diego, CA
    • Households earning $100k+: 55.3%
    • Poverty rate: 10.4%
    • Households spending >50% of income on housing: 20.8%
    • Poor mental health days: 17.3%
    • Life expectancy (years): 80.3
    • Percent of adults getting exercise: 81.7%
    • Population with health insurance: 94.3%
    • Marriage rate: 43.9%
    • Traffic volume per meter: 440.1
    • Access to activity space: 97.5%
    • Overcrowded households: 6.9%
    1. Lexington, KY
    • Households earning $100k+: 34.2%
    • Poverty rate: 12.1%
    • Households spending >50% of income on housing: 14.7%
    • Poor mental health days: 17.4%
    • Life expectancy (years): 76.7
    • Percent of adults getting exercise: 77.1%
    • Population with health insurance: 91.9%
    • Marriage rate: 42.5%
    • Traffic volume per meter: 163.7
    • Access to activity space: 97.4%
    • Overcrowded households: 2.2%
    1. Mesa, AZ
    • Households earning $100k+: 41.9%
    • Poverty rate: 10.8%
    • Households spending >50% of income on housing: 14.2%
    • Poor mental health days: 18.2%
    • Life expectancy (years): 77.5
    • Percent of adults getting exercise: 78%
    • Population with health insurance: 89%
    • Marriage rate: 48.5%
    • Traffic volume per meter: 244.2
    • Access to activity space: 92.8%
    • Overcrowded households: 4.4%
    1. Pittsburgh, PA
    • Households earning $100k+: 33.2%
    • Poverty rate: 20.1%
    • Households spending >50% of income on housing: 11.9%
    • Poor mental health days: 17.9%
    • Life expectancy (years): 76.9
    • Percent of adults getting exercise: 79%
    • Population with health insurance: 96%
    • Marriage rate: 33.6%
    • Traffic volume per meter: 202.3
    • Access to activity space: 93.3%
    • Overcrowded households: 0.9%
    1. Denver, CO
    • Households earning $100k+: 46.8%
    • Poverty rate: 12.1%
    • Households spending >50% of income on housing: 16.3%
    • Poor mental health days: 18.3%
    • Life expectancy (years): 77.4
    • Percent of adults getting exercise: 78.8%
    • Population with health insurance: 90.7%
    • Marriage rate: 40.5%
    • Traffic volume per meter: 415.7
    • Access to activity space: 99.1%
    • Overcrowded households: 3.1%
    1. Oakland, CA
    • Households earning $100k+: 51.2%
    • Poverty rate: 11.9%
    • Households spending >50% of income on housing: 18.1%
    • Poor mental health days: 17.8%
    • Life expectancy (years): 82
    • Percent of adults getting exercise: 81.2%
    • Population with health insurance: 94.1%
    • Marriage rate: 38.3%
    • Traffic volume per meter: 683
    • Access to activity space: 99.6%
    • Overcrowded households: 7.7%
    1. Spokane, WA
    • Households earning $100k+: 38.4%
    • Poverty rate: 12.7%
    • Households spending >50% of income on housing: 13.9%
    • Poor mental health days: 19.9%
    • Life expectancy (years): 76.9
    • Percent of adults getting exercise: 79.6%
    • Population with health insurance: 93.7%
    • Marriage rate: 41.9%
    • Traffic volume per meter: 150.4
    • Access to activity space: 87.6%
    • Overcrowded households: 2.1%
    1. Atlanta, GA
    • Households earning $100k+: 45.4%
    • Poverty rate: 15.8%
    • Households spending >50% of income on housing: 17.3%
    • Poor mental health days: 15.9%
    • Life expectancy (years): 77.5
    • Percent of adults getting exercise: 80%
    • Population with health insurance: 91.4%
    • Marriage rate: 31.8%
    • Traffic volume per meter: 384
    • Access to activity space: 93.8%
    • Overcrowded households: 2%
    1. Henderson, NV
    • Households earning $100k+: 48.3%
    • Poverty rate: 8.8%
    • Households spending >50% of income on housing: 18.5%
    • Poor mental health days: 18.4%
    • Life expectancy (years): 76.6
    • Percent of adults getting exercise: 73%
    • Population with health insurance: 94.2%
    • Marriage rate: 48%
    • Traffic volume per meter: 196.6
    • Access to activity space: 95.7%
    • Overcrowded households: 4.4%

    Data and Methodology

    Eighty-five of the largest U.S. cities for which data was available were evaluated across three categories: personal finance, well-being, and quality of life. Data comes from the U.S. Census Bureau 1-Year American Community Survey for 2024 and the County Health Rankings & Roadmaps for 2025.

    Personal finance metrics included:

    • Percent of individuals earning $100,000 or more.
    • Percent of households that spend 50% or more of their income on housing.
    • Percent of residents below the poverty level.

    Well-being metrics include:

    • Average percentage of days spent with poor mental health
    • Life expectancy in years.
    • Percentage of residents getting exercise.
    • Percentage of residents who have health insurance.

    Quality of life metrics include:

    • Marriage rate.
    • Average traffic volume per meter of major roadways in the county.
    • Percentage of population with adequate access to locations for physical activity.
    • Percentage of households with overcrowding, defined as more than one person living in a room.

    This story was produced by SmartAsset and reviewed and distributed by Stacker.

  • Bank of America foreclosed on a couple’s home by mistake. So they got a court order and showed up to foreclose on the bank.
    Photo credit: CanvaThe exterior of a bank and a happy couple reading a document.
    ,

    Bank of America foreclosed on a couple’s home by mistake. So they got a court order and showed up to foreclose on the bank.

    When the bank ignored them for months, the couple got a court order and showed up with a moving truck to take the bank’s furniture instead.

    Warren and Maureen Nyerges bought their home in Naples, Florida, in 2009. They paid cash. No mortgage, no bank involved, nothing. Bank of America foreclosed on it anyway.

    The bank had confused them with the previous owner, who actually did have an outstanding loan. A quick check of their own records would have cleared this up. According to the Nyerges’ attorney Todd Allen, it would have taken about 15 minutes. Nobody checked. The foreclosure went through.

    Warren called branch managers. He wrote certified letters to the bank’s president. Nothing came back. He eventually hired Allen, who got the foreclosure reversed within two months. The court also agreed that Bank of America should pay Warren’s legal fees of about $2,500. The bank was notified. Five months went by. No payment.

    At that point, reports ABC News, Warren went back to court and obtained a writ of execution: a court order giving him the legal authority to seize Bank of America’s assets to satisfy the debt. On June 3, 2011, he showed up at the local branch with two sheriff’s deputies and a moving truck.

    The deputies delivered the message to the branch manager: pay the $2,500, or they start loading furniture. After a call to superiors, the bank produced a check. They misspelled Warren’s name on it.

    Attorney Allen noted that Bank of America apologized for the payment delay but never for the wrongful foreclosure itself. A spokesperson eventually issued a statement: “We’re truly sorry for the series of unfortunate circumstances that Mr. Nyerges experienced.”

    The moving truck left empty. The deputies left with a check. Warren and Maureen still own their home.

Explore More Money Stories

Money

Bank of America foreclosed on a couple’s home by mistake. So they got a court order and showed up to foreclose on the bank.

Money

A millionaire swapped lives with a struggling family for a week on a $230 budget. The money wasn’t what broke him.

Money

Gen Z was asked if $75,000 a year counts as poor. Their answers say a lot about America right now.

Everyday Economics

Illustrator says the best way to stay motivated when learning a new hobby is to spend money