It has become more difficult for people to become new homeowners now more than ever. The average cost to buy a house in the United States is over $500,000, and having a single-family home built on your property could cost an average of $323,000. However, some people today are looking for homes the same way you might look for other deals: on Amazon.
Amazon is offering customizable “tiny houses” with a front porch for under $11,000. That’s nearly twice as cheap as the average used car. The small house promises consumers to be easily assembled without any drills or nails involved due to its foldable design. There is customization in mind in which potential buyers can purchase extra rooms and amenities such as solar panels and rainwater harvesting for an additional cost. For some models, you can purchase additional floors to stack onto the base kit. This could sound like a dream for many non-homeowners, as a 2024 survey found that the majority of them don’t (or can’t) buy a home due to lower incomes and higher cost of living.
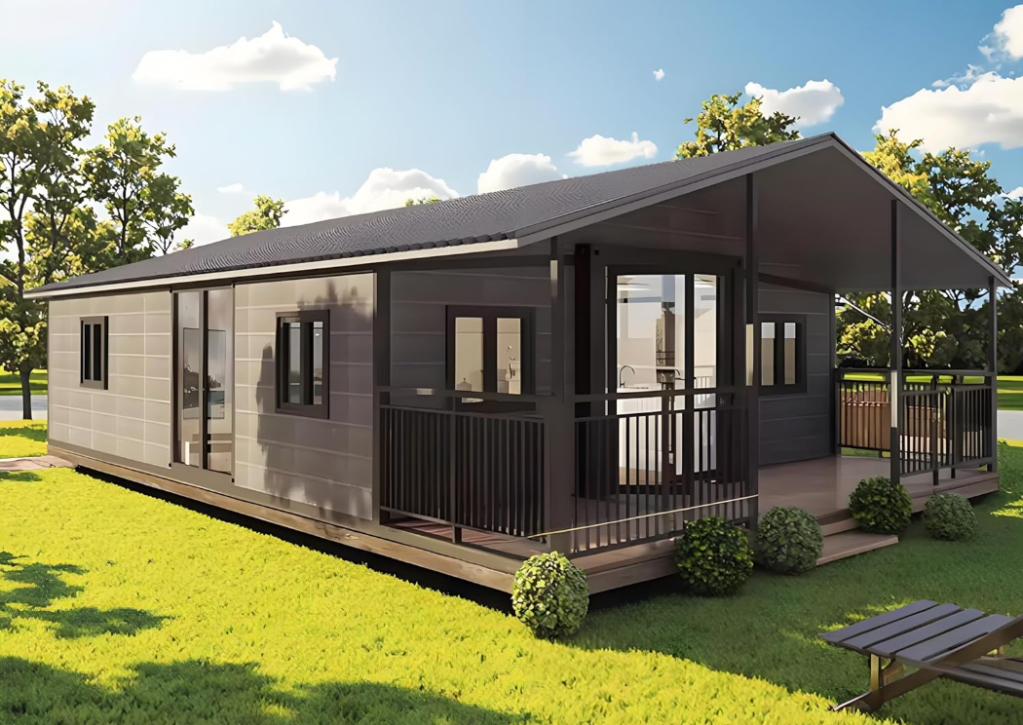
These homes advertise “a hassle-free setup, making it perfect for minimalist living, vacation homes, or rental investments.” They also ensure that the homes are made with weather-resistant materials that make the houses “built to last.”
The appeal of these small Amazon-delivered homes is similar to the tiny house movement and trend of the aughts through the 2010s. Tiny homes were seen as a way to live a minimalist lifestyle, whether that motivation was due to environmental concern, personal finances, or both. While living in much smaller homes with less amenities, tiny homes offer less of a negative environmental impact since they use less electricity and water compared to regular houses. Along with that, most tiny homeowners are able to live without accruing debt or paying a mortgage, which is good since most lenders won’t qualify tiny homes for financing. If the environment and economics wasn’t enough of an appeal, much of the tiny home trend can be attributed to social media hype and channels dedicated to tiny house living.
While purchasing a tiny home from Amazon sounds tempting given the price tag, there are some catches and caveats to be aware of. While advertised as “built to last” and “weather-resistant,” many prefab tiny homes aren’t automatically made for year-round living and are advertised as “seasonal” or “rental” properties. This means that there could be issues regarding heating and cooling the home during seasons of extreme cold or heat. As previously mentioned, many lenders aren’t willing to finance the purchase of tiny homes and it’s difficult to get homeowners insurance protection for them. Lastly, you could be living in a state which has strict zoning requirements for tiny houses or doesn’t allow them at all.
However, with the current housing market being dominated by private investors over traditional buyers and conventional homeownership becoming less achievable, a person may be willing to navigate all of the aforementioned hassles and risks to live in their own place. In terms of how this will impact the real estate market or create a lasting change in American culture, time will tell.
To truly understand the context of a household’s income, it must be compared to local costs and long-term goals, which both may fluctuate over time. For most people, the same pillars will make up the biggest nonnegotiables in their budget. These include basic necessities like housing, groceries, utilities, and transportation, and likely some discretionary spending on hobbies, activities, and other enrichment. In an attempt to secure this lifestyle for the future, many households aim to save some of their income for emergencies, investments, retirement, education, and other long-term goals. A common budgeting technique that encapsulates these three pillars is called the 50/30/20 rule: 50% of your post-tax income goes to needs, 30% to your wants, and 20% gets set aside for the future.
With this in mind, SmartAsset assessed the salary needed to reach this 50/30/20 ideal — designated as a comfortable salary — based on the local costs in 100 of the largest U.S. cities.
Key Findings
A single adult needs to earn $150,000 to live comfortably in these places. New York has the highest individual salary needed to live comfortably at $158,954. San Jose, California, follows closely at $158,080. Orange County cities Irvine, Anaheim, and Santa Ana require an estimated $151,965 in income for a single adult.
These cities have the lowest salary needed to live comfortably. San Antonio has the lowest salary threshold for both single adults and families of four at $83,242 and $192,608, respectively. New Orleans has the second-lowest salary needed for a single adult to live comfortably at $84,406, followed by Memphis, Tennessee, at $86,320.
The Bay Area is the most expensive place for a family to live comfortably. Bay Area cities make up the top four of the five places with the highest salary needed for a family of four to live comfortably. Incomes across two parents are projected at $407,597 in San Francisco, $402,771 in San Jose, and $371,488 in both Fremont and Oakland. Boston rounds out the top five at $368,742.
Families in these Texas cities are closest to a comfortable salary. In Frisco, the median household earns $145,444 — substantially higher than the national median of $83,730. This figure also accounts for 63.1% of the $230,464 income a family of four in Frisco needs to live comfortably. In McKinney, the $124,177 median household income accounts for 53.9% of the $230,464 needed.
10 Cities With the Highest Salary Needed to Live Comfortably
1. New York, New York
Salary needed for a single adult: $158,954
Salary needed for a working family of four: $337,875
Median household income: $81,228
2. San Jose, California
Salary needed for a single adult: $158,080
Salary needed for a working family of four: $402,771
Median household income: $148,226
3. (tie) Irvine, California
Salary needed for a single adult: $151,965
Salary needed for a working family of four: $327,226
Median household income: $145,731
3. (tie) Anaheim, California
Salary needed for a single adult: $151,965
Salary needed for a working family of four: $327,226
Median household income: $101,145
3. (tie) Santa Ana, California
Salary needed for a single adult: $151,965
Salary needed for a working family of four: $327,226
Median household income: $95,118
6. Boston, Massachusetts
Salary needed for a single adult: $139,776
Salary needed for a working family of four: $368,742
Median household income: $97,791
7. (tie) San Diego, California
Salary needed for a single adult: $136,781
Salary needed for a working family of four: $312,915
Median household income: $111,032
7. (tie) Chula Vista, California
Salary needed for a single adult: $136,781
Salary needed for a working family of four: $312,915
Median household income: $105,101
9. San Francisco, California
Salary needed for a single adult: $134,950
Salary needed for a working family of four: $407,597
Median household income: $139,801
10. (tie) Fremont, California
Salary needed for a single adult: $134,410
Salary needed for a working family of four: $371,488
Median household income: $175,816
10. (tie) Oakland, California
Salary needed for a single adult: $134,410
Salary needed for a working family of four: $371,488
Median household income: $102,235
10 Cities With the Lowest Salary Needed to Live Comfortably
San Antonio, Texas
Salary needed for a single adult: $83,242
Salary needed for a working family of four: $192,608
Median household income: $66,176
New Orleans, Louisiana
Salary needed for a single adult: $84,406
Salary needed for a working family of four: $197,766
Median household income: $58,821
Memphis, Tennessee
Salary needed for a single adult: $86,320
Salary needed for a working family of four: $193,939
Median household income: $52,679
Oklahoma City, Oklahoma
Salary needed for a single adult: $86,861
Salary needed for a working family of four: $213,325
Median household income: $70,040
Baltimore, Maryland
Salary needed for a single adult: $87,485
Salary needed for a working family of four: $224,224
Median household income: $64,778
Louisville, Kentucky
Salary needed for a single adult: $88,234
Salary needed for a working family of four: $212,742
Median household income: $67,251
Tulsa, Oklahoma
Salary needed for a single adult: $88,317
Salary needed for a working family of four: $215,238
Median household income: $60,930
Winston-Salem, North Carolina
Salary needed for a single adult: $88,442
Salary needed for a working family of four: $205,421
Median household income: $57,758
Tucson, Arizona
Salary needed for a single adult: $88,899
Salary needed for a working family of four: $218,400
Median household income: $60,483
Fort Wayne, Indiana
Salary needed for a single adult: $88,982
Salary needed for a working family of four: $233,126
Median household income: $61,436
Data and Methodology
SmartAsset used MIT Living Wage Calculator data to gather the basic cost of living for an individual with no children and for two working adults with two children. Data includes the cost of necessities, including housing, food, transportation, and income taxes. It was last updated to reflect the most recent data available on Feb. 15, 2026.
Applying these costs to the 50/30/20 budget for 100 of the largest U.S. cities, MIT’s living wage is assumed to cover needs (i.e., 50% of one’s budget). From there, the total annual wage was extrapolated for individuals and families to spend 30% of the total on wants and 20% on savings or debt payments. Median household income data for cities comes from the U.S. Census Bureau’s 1 Year American Community Survey for 2024.
Happiness may not be easy to quantify, but some qualifiers may make a person more likely to feel satisfied in life. A reasonable degree of financial freedom can alleviate worry about day-to-day costs and the occasional unexpected expense. Similarly, good relationships, overall health and longevity, basic conveniences, and privacy can go a long way in keeping stress down and contentment up. While none of these things alone are the secret to happiness, they may all individually contribute to a life geared toward wants rather than needs — freeing up time and resources for individuals to explore and build a life on their own terms.
With this in mind, SmartAsset ranked 85 of the largest U.S. cities with available data based on 11 happiness factors spanning personal finance, physical and mental well-being, and quality of life factors.
Key Findings
Arlington, VA, ranks as the happiest city for 2026. Arlington ranks among the top five cities for a variety of happiness metrics, including life expectancy (83.9 years), household earnings over $100,000 (64.3%), mentally healthy days (84.9%), adults getting exercise (83%), and access to activity spaces (100%).
Fremont, CA, households outearn their peers. Ranking second overall for happiest cities, 70.7% of Fremont households earn over $100,000, the most studywide. This pairs with the lowest poverty rate of 4.7%. However, 18.1% of households in Fremont end up spending 50% or more of their income on housing. In tandem, the population maintains the highest rate of health insurance coverage and marriage, at 98.1% and 63.8%, respectively.
Austin, TX, has the least traffic. The traffic volume per meter in Austin, Texas — a practice ground for many autonomous vehicle companies — is lowest studywide at 42.1. This pales in comparison to Boston, which has over 40 times the traffic volume per meter at 1753.9. The average traffic volume per meter is 299.
Residents have the most mentally healthy days in Honolulu. Ranking 16th happiest overall, Honolulu residents feel mentally healthy for 85.2% of days. San Jose, California, follows closely at 85% mentally healthy days. On the other end of the spectrum, the residents of Toledo, Ohio, have the worst mental health ranking, at 78.2% of days spent mentally healthy.
These California cities have the most overcrowding in housing. Privacy and space can go a long way in making a person comfortable in their own space, and can be indicative of financial resources. In Long Beach, Los Angeles, and Fresno, just over 10% of households are home to more than one person per bedroom. Laredo, Texas, also falls into this category of high overcrowding. Meanwhile, Pittsburgh has the lowest rate of overcrowding at 0.9%.
Top 25 Happiest Cities
Arlington, VA
Households earning $100k+: 64.3%
Poverty rate: 8.3%
Households spending >50% of income on housing: 14.2%
Poor mental health days: 15.1%
Life expectancy (years): 83.9
Percent of adults getting exercise: 83%
Population with health insurance: 93.9%
Marriage rate: 44.2%
Traffic volume per meter: 540
Access to activity space: 100%
Overcrowded households: 3.4%
Fremont, CA
Households earning $100k+: 70.7%
Poverty rate: 4.7%
Households spending >50% of income on housing: 18.1%
Poor mental health days: 17.8%
Life expectancy (years): 82
Percent of adults getting exercise: 81.2%
Population with health insurance: 98.1%
Marriage rate: 63.8%
Traffic volume per meter: 683
Access to activity space: 99.6%
Overcrowded households: 7.7%
San Jose, CA
Households earning $100k+: 64.2%
Poverty rate: 8.1%
Households spending >50% of income on housing: 15.7%
Poor mental health days: 15%
Life expectancy (years): 83.8
Percent of adults getting exercise: 80.9%
Population with health insurance: 95.6%
Marriage rate: 48.6%
Traffic volume per meter: 626.4
Access to activity space: 99.4%
Overcrowded households: 7.9%
Seattle, WA
Households earning $100k+: 57.1%
Poverty rate: 9.4%
Households spending >50% of income on housing: 15%
Poor mental health days: 16.6%
Life expectancy (years): 81.1
Percent of adults getting exercise: 86.7%
Population with health insurance: 96.3%
Marriage rate: 39.5%
Traffic volume per meter: 333
Access to activity space: 97.9%
Overcrowded households: 3.9%
Raleigh, NC
Households earning $100k+: 43%
Poverty rate: 13.3%
Households spending >50% of income on housing: 12%
Poor mental health days: 15.7%
Life expectancy (years): 81
Percent of adults getting exercise: 84.2%
Population with health insurance: 92.9%
Marriage rate: 38.8%
Traffic volume per meter: 111.6
Access to activity space: 98.6%
Overcrowded households: 2%
Boise, ID
Households earning $100k+: 39.9%
Poverty rate: 12.9%
Households spending >50% of income on housing: 10.9%
Poor mental health days: 17.1%
Life expectancy (years): 79.7
Percent of adults getting exercise: 82.4%
Population with health insurance: 93.1%
Marriage rate: 44.2%
Traffic volume per meter: 116.7
Access to activity space: 91.6%
Overcrowded households: 1.9%
Lincoln, NE
Households earning $100k+: 33.5%
Poverty rate: 13.4%
Households spending >50% of income on housing: 12.6%
Poor mental health days: 15.3%
Life expectancy (years): 79.1
Percent of adults getting exercise: 78.9%
Population with health insurance: 93.4%
Marriage rate: 47%
Traffic volume per meter: 211.1
Access to activity space: 95.4%
Overcrowded households: 2.2%
Anchorage, AK
Households earning $100k+: 53.9%
Poverty rate: 8.3%
Households spending >50% of income on housing: 13.2%
Poor mental health days: 16.3%
Life expectancy (years): 76.3
Percent of adults getting exercise: 80.1%
Population with health insurance: 90.6%
Marriage rate: 48.7%
Traffic volume per meter: 152.3
Access to activity space: 93.9%
Overcrowded households: 4.5%
San Francisco, CA
Households earning $100k+: 61%
Poverty rate: 11.3%
Households spending >50% of income on housing: 16.9%
Poor mental health days: 16.6%
Life expectancy (years): 82.4
Percent of adults getting exercise: 83.6%
Population with health insurance: 97.2%
Marriage rate: 39.1%
Traffic volume per meter: 794
Access to activity space: 100%
Overcrowded households: 6.8%
Minneapolis, MN
Households earning $100k+: 40.3%
Poverty rate: 15.1%
Households spending >50% of income on housing: 13.4%
Poor mental health days: 16.1%
Life expectancy (years): 79.5
Percent of adults getting exercise: 83.3%
Population with health insurance: 94.3%
Marriage rate: 34%
Traffic volume per meter: 304.6
Access to activity space: 99.1%
Overcrowded households: 2.7%
Colorado Springs, CO
Households earning $100k+: 41.6%
Poverty rate: 8.8%
Households spending >50% of income on housing: 14.4%
Poor mental health days: 18.4%
Life expectancy (years): 76.2
Percent of adults getting exercise: 81.5%
Population with health insurance: 91.5%
Marriage rate: 52.6%
Traffic volume per meter: 140.9
Access to activity space: 89.8%
Overcrowded households: 2.5%
Aurora, CO
Households earning $100k+: 46.4%
Poverty rate: 10.7%
Households spending >50% of income on housing: 15.6%
Poor mental health days: 17.1%
Life expectancy (years): 79.1
Percent of adults getting exercise: 82.4%
Population with health insurance: 85.6%
Marriage rate: 44.9%
Traffic volume per meter: 215.2
Access to activity space: 97.5%
Overcrowded households: 3%
Charlotte, NC
Households earning $100k+: 43.7%
Poverty rate: 11.9%
Households spending >50% of income on housing: 14.3%
Poor mental health days: 16.3%
Life expectancy (years): 78.8
Percent of adults getting exercise: 81.1%
Population with health insurance: 87.9%
Marriage rate: 40.4%
Traffic volume per meter: 165.5
Access to activity space: 88.7%
Overcrowded households: 2.3%
Omaha, NE
Households earning $100k+: 35.5%
Poverty rate: 14.2%
Households spending >50% of income on housing: 13.1%
Poor mental health days: 15.9%
Life expectancy (years): 77.7
Percent of adults getting exercise: 75.7%
Population with health insurance: 91.2%
Marriage rate: 44.3%
Traffic volume per meter: 214.9
Access to activity space: 97.4%
Overcrowded households: 2.1%
Chula Vista, CA
Households earning $100k+: 52%
Poverty rate: 9.6%
Households spending >50% of income on housing: 20.8%
Poor mental health days: 17.3%
Life expectancy (years): 80.3
Percent of adults getting exercise: 81.7%
Population with health insurance: 94.8%
Marriage rate: 50.2%
Traffic volume per meter: 440.1
Access to activity space: 97.5%
Overcrowded households: 6.9%
Honolulu, HI
Households earning $100k+: 44.5%
Poverty rate: 10.5%
Households spending >50% of income on housing: 19.4%
Poor mental health days: 14.8%
Life expectancy (years): 81.7
Percent of adults getting exercise: 77.8%
Population with health insurance: 96.8%
Marriage rate: 45.1%
Traffic volume per meter: 536.2
Access to activity space: 96.6%
Overcrowded households: 8.7%
San Diego, CA
Households earning $100k+: 55.3%
Poverty rate: 10.4%
Households spending >50% of income on housing: 20.8%
Poor mental health days: 17.3%
Life expectancy (years): 80.3
Percent of adults getting exercise: 81.7%
Population with health insurance: 94.3%
Marriage rate: 43.9%
Traffic volume per meter: 440.1
Access to activity space: 97.5%
Overcrowded households: 6.9%
Lexington, KY
Households earning $100k+: 34.2%
Poverty rate: 12.1%
Households spending >50% of income on housing: 14.7%
Poor mental health days: 17.4%
Life expectancy (years): 76.7
Percent of adults getting exercise: 77.1%
Population with health insurance: 91.9%
Marriage rate: 42.5%
Traffic volume per meter: 163.7
Access to activity space: 97.4%
Overcrowded households: 2.2%
Mesa, AZ
Households earning $100k+: 41.9%
Poverty rate: 10.8%
Households spending >50% of income on housing: 14.2%
Poor mental health days: 18.2%
Life expectancy (years): 77.5
Percent of adults getting exercise: 78%
Population with health insurance: 89%
Marriage rate: 48.5%
Traffic volume per meter: 244.2
Access to activity space: 92.8%
Overcrowded households: 4.4%
Pittsburgh, PA
Households earning $100k+: 33.2%
Poverty rate: 20.1%
Households spending >50% of income on housing: 11.9%
Poor mental health days: 17.9%
Life expectancy (years): 76.9
Percent of adults getting exercise: 79%
Population with health insurance: 96%
Marriage rate: 33.6%
Traffic volume per meter: 202.3
Access to activity space: 93.3%
Overcrowded households: 0.9%
Denver, CO
Households earning $100k+: 46.8%
Poverty rate: 12.1%
Households spending >50% of income on housing: 16.3%
Poor mental health days: 18.3%
Life expectancy (years): 77.4
Percent of adults getting exercise: 78.8%
Population with health insurance: 90.7%
Marriage rate: 40.5%
Traffic volume per meter: 415.7
Access to activity space: 99.1%
Overcrowded households: 3.1%
Oakland, CA
Households earning $100k+: 51.2%
Poverty rate: 11.9%
Households spending >50% of income on housing: 18.1%
Poor mental health days: 17.8%
Life expectancy (years): 82
Percent of adults getting exercise: 81.2%
Population with health insurance: 94.1%
Marriage rate: 38.3%
Traffic volume per meter: 683
Access to activity space: 99.6%
Overcrowded households: 7.7%
Spokane, WA
Households earning $100k+: 38.4%
Poverty rate: 12.7%
Households spending >50% of income on housing: 13.9%
Poor mental health days: 19.9%
Life expectancy (years): 76.9
Percent of adults getting exercise: 79.6%
Population with health insurance: 93.7%
Marriage rate: 41.9%
Traffic volume per meter: 150.4
Access to activity space: 87.6%
Overcrowded households: 2.1%
Atlanta, GA
Households earning $100k+: 45.4%
Poverty rate: 15.8%
Households spending >50% of income on housing: 17.3%
Poor mental health days: 15.9%
Life expectancy (years): 77.5
Percent of adults getting exercise: 80%
Population with health insurance: 91.4%
Marriage rate: 31.8%
Traffic volume per meter: 384
Access to activity space: 93.8%
Overcrowded households: 2%
Henderson, NV
Households earning $100k+: 48.3%
Poverty rate: 8.8%
Households spending >50% of income on housing: 18.5%
Poor mental health days: 18.4%
Life expectancy (years): 76.6
Percent of adults getting exercise: 73%
Population with health insurance: 94.2%
Marriage rate: 48%
Traffic volume per meter: 196.6
Access to activity space: 95.7%
Overcrowded households: 4.4%
Data and Methodology
Eighty-five of the largest U.S. cities for which data was available were evaluated across three categories: personal finance, well-being, and quality of life. Data comes from the U.S. Census Bureau 1-Year American Community Survey for 2024 and the County Health Rankings & Roadmaps for 2025.
Matt Fiddes runs a multi-million dollar martial arts franchise in Britain. His family’s weekly budget runs around $2,058. He’d never really looked at a price tag before buying something.
For a social experiment documented by the YouTube channel Only Human, the Fiddes family swapped lives with the Leamons (Andy, Kim, their two kids, and two dogs) who get by on $230 a week. Kim had a life-saving surgery after an accident and now lives with Chronic Regional Pain Syndrome. They lost their savings. Andy works alone to support the family.
On day one of the swap, Matt learned his weekly budget was $230. “That basically fills up the fuel tank of my car,” he said.
A man calculating his budget on his laptop. Photo credit: Canva
What followed was a week of grocery bills he had to think about, a neighborhood with nothing much in it, and night shifts, something he’d never worked in his life. His wife Moniqe cried when she heard about Kim’s condition from the Leamons’ friends.
By the end of the week, Matt had something to say that was harder to shrug off than the budget: “I feel guilty; no one should live like this.”
He also said the week brought his family closer together. The Fiddes left a gift behind for the Leamons when they returned home: a mobility scooter for Kim, so she could get around on her own.
The Leamons, meanwhile, spent the week in the Fiddes’ house taking their kids to a theme park and doing a little shopping experiencing, briefly, what it feels like when money isn’t a constant calculation.
One YouTube commenter put it plainly: “I feel this was a much-needed vacation for the poor family and a grounding experience for the rich family.” That’s about right.