In February 2024, a job posting surfaced on social media, sparking laughter and curiosity among hundreds of people who applied. The job description mentioned that shortlisted candidates would spend five months in a snowy desert, surrounded by gentoo penguins, performing tasks like sorting thousands of postcards and cleaning up penguin poop. The job, posted by the “Penguin Post Office,” is for the most remote post office in the world, located in Antarctica, according to The Washington Post.
Image Source: Gentoo Penguins walk around the British base in Antarctica
The position was to be filled by four candidates who would then work in a five-month role in Port Lockroy from November to March. The selected candidates are required to count penguins because the eight-decade-old football-field-size post office building in Goudier Island is populated by hundreds of penguins.
The post office is managed by the U.K. Antarctic Heritage Trust. The trust posted multiple job posters on its Instagram, attracting the attention of job seekers. However, applicants were warned that the job is not as creative as it sounds. Shortlisted candidates would have to stay in a common lodge, sleep on bunk beds, and share a common bathroom. Apart from meager hygiene and sanitation facilities, the employees would also have to stay without running water, internet, or phone services for the stated term. Only when a visiting ship would arrive, the employees would be able to take a shower and load up their jerry cans with water.
Representative Image Source: Pexels | Pixabay
“Living there is quite hard work,” Camilla Nichol, the chief executive of the trust, explained to the publication. “You might be working 12-hour days. There’s not much time for rest and relaxation.” However, despite the scanty conditions, the post office receives hundreds of applications each summer. One year, the count even surpassed 2,500 applications.
“We get people of all ages from all over the world,” Nichol said, adding that candidates from all walks of life apply for the six-month contract. “We are looking for people who are fit and resilient and really love meeting people and visitors.” Plus, she added, “You’ve got to get along because you can’t get away from each other very easily. We’re looking for a team; four people who can live and work together.”
Lucy Dorman, a former employee, described that the workers are made familiar with each other’s habits and quirks during the training period. During the job, they work together to perform tasks like carrying boxes, buckets or jerrycans through the slippery rocks, or brushing away penguin poop off the rocks to keep the site clean. “Most people are probably not so aware of how smelly they are,” Lucy joked, also noting that “it’s a privilege to spend time close to wildlife.”
Representative Image Source: Penguins are seen on December 19, 2021, in Antarctic Peninsula, Antarctica. (Photo by Nick Ut/Getty Images)
During the term of the application process, Nichol urged people to apply for the job because it’s life-changing. “You can watch the sun go down and hear the glacier ice melting. It’s an extraordinary place,” she said. The four postmaster roles included base leader, shop manager, and two general assistants. Applications are currently closed for the season which begins in November 2024.
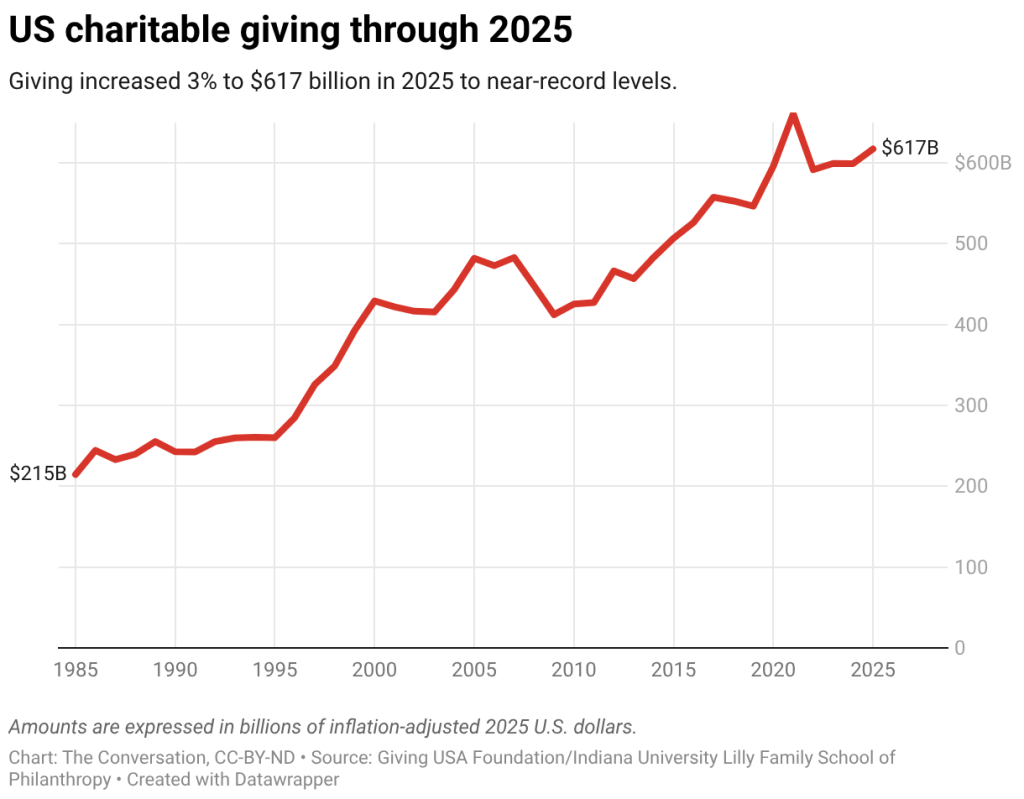
The $617 billion that Americans gave to everything from churches to cat rescues was the second-highest ever in inflation-adjusted terms, but it fell short of the record set in 2021, when there was a burst of social services giving in response to the COVID-19 pandemic.
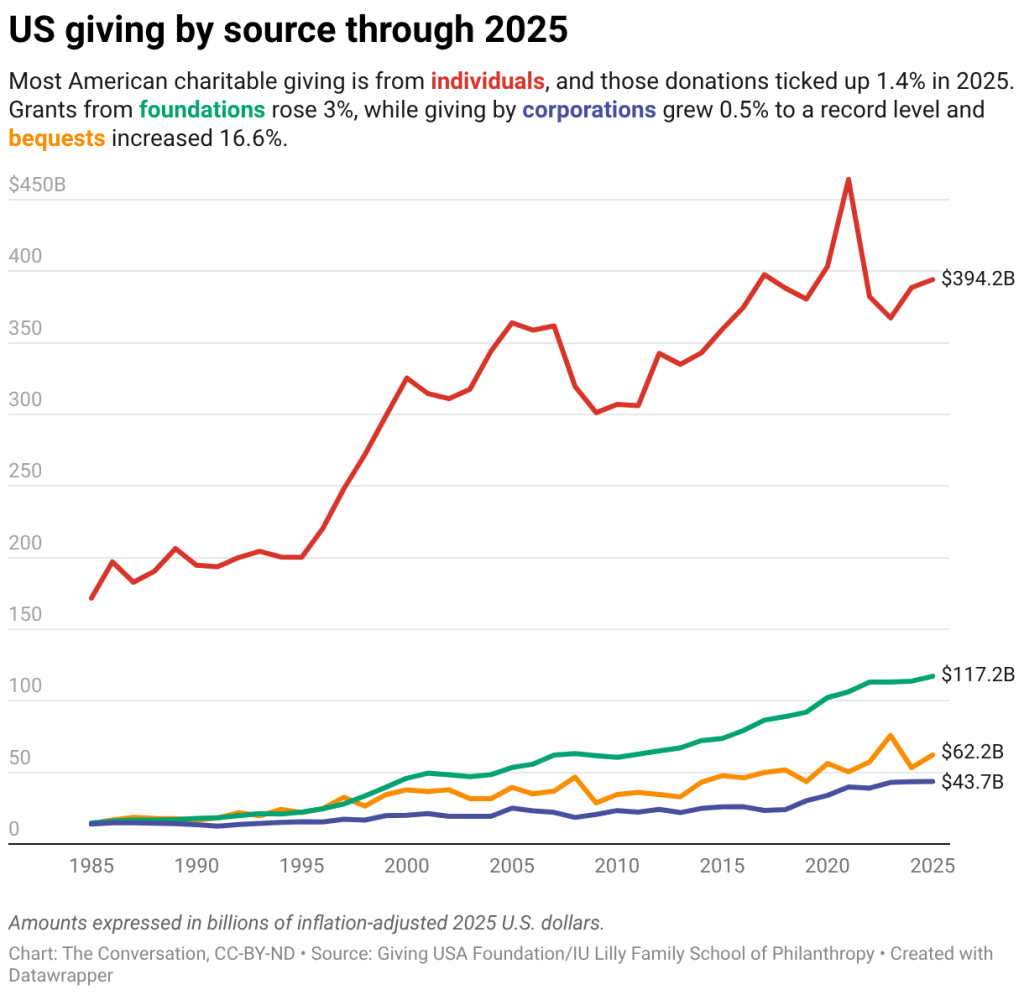
Charitable bequests – gifts to causes that happen after someone dies – represented about 10% of all U.S. giving in 2025, up from 9% in 2024. They grew by 16.6% to $62 billion in 2025, faster than all other sources of donations. Bequeathed gifts have exceeded $50 billion every year since 2022, growing significantly in three of the past four years.
There are several possible reasons for this increase. One is the impending passing of tens of trillions of dollars in wealth from people over 65 to their younger heirs, often called the “great wealth transfer.” However, the total value of charitable bequests may be rising simply because stocks have been performing better than normal for several years. The stock market boom has increased the net worth of the estates of the wealthiest Americans, who are the main people making these gifts after death.
This value does vary greatly year to year, partly because even a single very large bequest can significantly skew the total amount. And when these changes will occur is unpredictable due to the complexity of multibillion-dollar estates, which can get paid out several years after a wealthy person dies. For example, Microsoft co-founder Paul Allen, who died in 2018, was among the largest donors of 2025 due to the $3.1 billion bequest his estate made.
Giving by foundations also tends to respond to strong stock market growth. By law, private foundations must spend at least 5% of their assets for charitable purposes, primarily through grants to nonprofits, to retain their tax-exempt status. Endowment growth tends to boost what foundations disburse.
Giving by foundations, which accounted for about 1 in 5 dollars given to charity in 2025, rose by 3% to $117 billion – an all-time high, even when adjusting for inflation. Giving by foundations has not decreased in any year in real terms since 2010.
Giving by individuals, whether they’re rich, poor or in between, is clearly influenced by consumer sentiment and other trends that affect typical households more directly. And consumer sentiment declined in 2025 to the lowest annual level ever recorded.
Giving by individuals grew by 1.4% in 2025, though that share of charitable giving has gradually shrunk. It dipped to 64% of the total in 2025 – the second-lowest share of total giving ever.
Corporate giving was responsible for around 7% of all charitable gifts made in 2025 – a record high. It totaled $44 billion in 2025, up 0.5% from a year earlier. Giving by corporations has grown by almost 30% since 2020 in inflation-adjusted terms.
Most kinds of donations increased
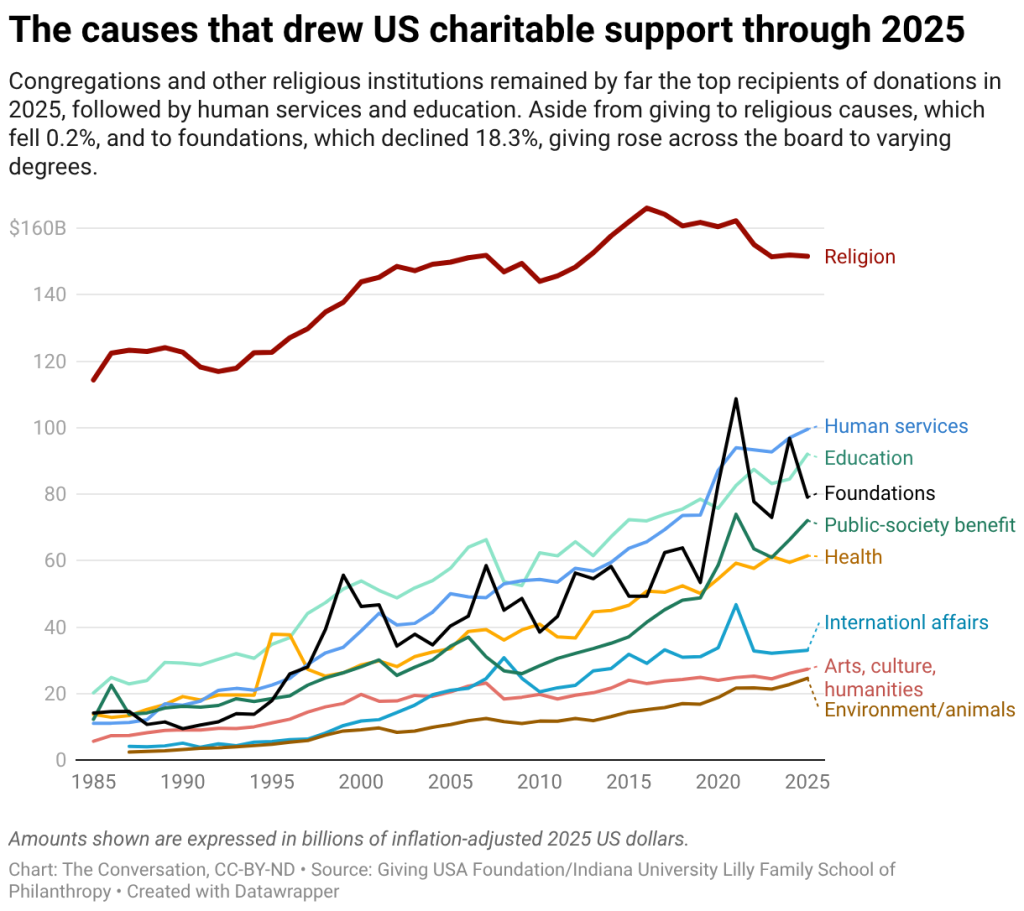
Donations to seven of the nine charitable categories that Giving USA tracks grew.
One exception was gifts to houses of worship and religious institutions. Religious giving was essentially flat in inflation-adjusted terms, with a 0.2% decline. That’s in keeping with a long-term trend.
Religious giving has barely budged in the U.S. over the past two decades, increasing by only 1.2% since 2005. That pace is the most sluggish of all the categories we track. Even so, the $152 billion Americans gave to congregations and other religious institutions remains by far the largest category. It accounted for 23% of all donations in 2025.
The other exception was gifts to foundations, which fell 18.3% in 2025 after surging to their second-highest level ever in 2024. In 2025 they represented 12% of all giving, totaling $79 billion.
Giving to social services nonprofits, such as food banks and homeless shelters, grew 2.6% in 2025, reaching almost $100 billion. That marked a record high and represented 15% of all giving.
Giving to education and public-society benefit causes, categories associated with wealthier donors, grew the most in 2025.
Charitable gifts for education, which primarily support colleges and universities, grew 8.9% – faster than any other category in 2025. They totaled $92 billion, an all-time high.
Public-society benefit giving grew by 8.7% to $72 billion. This category consists of organizations serving the public more generally, such as advocacy organizations, independent research institutions and donor-advised funds, which function as charitable investment accounts.
Giving to several other categories reached record highs, including the $61 billion Americans donated to hospitals and other health-related causes; the $27 billion they gave to the arts; and $25 billion dispatched to nonprofits tied to the environment and animals.
While charitable donations did grow broadly in 2025, the giving categories the wealthiest Americans tend to favor – bequests, foundations, education, public-society benefit organizations – fared better than usual. Giving by less affluent U.S. donors – gifts from individuals and donations to religious institutions – lagged.
Beginning in 2026, however, virtually all U.S. taxpayers will have some incentive to make charitable gifts due to the addition of the universal charitable deduction as part of President Donald Trump’s big package of tax and spending measures that Republican lawmakers passed in July 2025. That should increase the number of donors who make modest gifts to charity.
Photo credit: AP Photo/John Locher – A recent settlement with farm equipment manufacturer John Deere made it easier for farmers to repair machines on their own, a win for the ‘right to repair’ movement.
The “right to repair” movement is gaining steam as consumers push corporations to offer them more freedom to fix products – from cars to dishwashers to toys.
In April 2026, farm equipment maker Deere & Co. inked a US$99 million settlement in a class action suit over its prohibition on independent repairs to its increasingly high-tech equipment – another win for the movement. While the company didn’t admit wrongdoing, it will let farmers make more repairs themselves.
Equally significant, this case showed that the Federal Trade Commission, a lead plaintiff, may be more willing to protect consumers against the growing corporate control over servicing products after purchase.
Even President Donald Trump has weighed in. At an Oval Office event on June 4, 2026, he described existing restrictions as “strange” after he met with auto executives. “Nobody’s allowed to fix their car. … So I thought we’d do something about that,” he said, without offering details.
This push is understandable. As consumers want more reliable products, gaining the right to repair them with their own parts makes sense.
But they often overlook existing protections in their product warranties, which obligate the manufacturer to repair or replace if something goes wrong.
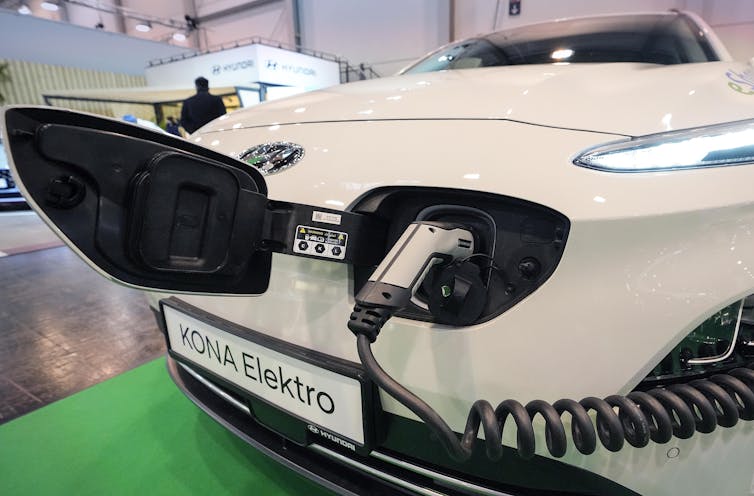
As a scholar focused on operational sustainability in supply chains, I have found that strong warranties aren’t just a safety net for buyers. They help companies build trust and stand out. Hyundai and Apple, for example, have used strong warranty programs to keep customers coming back for repairs within their own networks while maintaining profit margins. But many shoppers overlook this tool as the political momentum for the right to repair grows.
Back to the 1970s
Many automotive and electronics manufacturers have been making it harder for consumers to use parts not produced or authorized by the original manufacturer. For example, data can be transmitted back to the manufacturer in real time and flag a part from an independent supplier as incompatible.
Another common tactic is the use of “warranty void” stickers, which claim that repairs done by a third-party service will cancel the manufacturer’s product warranty. These practices have drawn widespread criticism for suppressing competition and encouraging planned obsolescence – and are among the main targets of right to repair advocates.
But consumers have a tool that’s widely underused: A 1975 law that prohibits voiding a warranty simply because an independent mechanic or a part from an independent vendor was used. This measure was designed to discourage the production or sale of low-quality products and sought to protect consumers from excessively restrictive coverage and bad-faith corporate negligence.
It was this law as well as several other consumer protections that the Biden administration’s FTC cited in 2024 when it warned several companies that they improperly restricted their warranty terms.
One reason consumers are largely unaware is that most find the text of warranty terms and the disclaimers difficult to read. And this isn’t an accident. Many manufacturers see warranties as sunk costs that should be avoided, and they have no incentives to clarify the terms or honor them.
Trust pays
Companies should rethink their approach to warranties – because it makes good business sense.
When manufacturers see they can no longer prevent third-party repairs, or offer warranties that are hard to redeem, it’s usually because they decide it’s more cost efficient to produce low-quality products. But that choice often cuts into the producer’s own profit while leaving the consumer worse off – and has a worse environmental impact, a recent study suggests.
Hyundai vehicles, including the Kona electric car, have built up customer loyalty through the flexible warranties offered by the automaker. AP Photo/Martin Meissner
A smarter option for manufacturers would be to establish a better, more efficient service network and offer more attractive warranty programs to retain customer loyalty.
Some companies have demonstrated that strong warranties pay off. Outdoor apparel maker Patagonia offers an “ironclad guarantee” to repair or replace its products for any reason. The “all mighty guarantee” offered by Osprey, which also manufactures outdoor gear, will repair or replace any damaged or defective product free of charge.
Then there’s retail giant Costco’s automatic extension of manufacturers’ warranties on major appliances and electronics – a major driver of its success.
Meanwhile, under the right to repair measures currently proposed, the post-purchase service and repair markets would likely get more competitive. New rules would let outside service providers and warranty companies gain better access to fix the products. Extended warranties and service contracts would then become even more prevalent, and manufacturers would need to become more vigilant.
Consumers also need more protection from the FTC, the top federal regulator tasked with consumer protection. Indeed, the right to repair movement reflects, in part, public disappointment that the government has failed to serve as a watchdog amid misleading corporate claims about warranty protections.
While the FTC has occasionally sued companies to protect consumer rights under the 1975 law, it has the legal tools to be more aggressive. Such a shift would not only change the corporate culture around warranties but send a message to consumers that warranties should work for them.
Enforcement, not just choice
If manufacturers embraced stronger warranty enforcement, consumers would benefit the most, provided they’re aware of what these protections entail. But manufacturers would come out ahead, too. By building up efficient service networks and offering more versatile warranties, they would remain competitive and foster customer loyalty, Hyundai being a good example.
The right to repair movement is in many ways a live policy experiment on expanding access to repair markets and giving consumers more choices. But more choices don’t necessarily lead to a better outcome. Coupling repair rights with stronger warranties and better enforcement is the best way a company can claim the prize it always says it wants: more satisfied consumers.
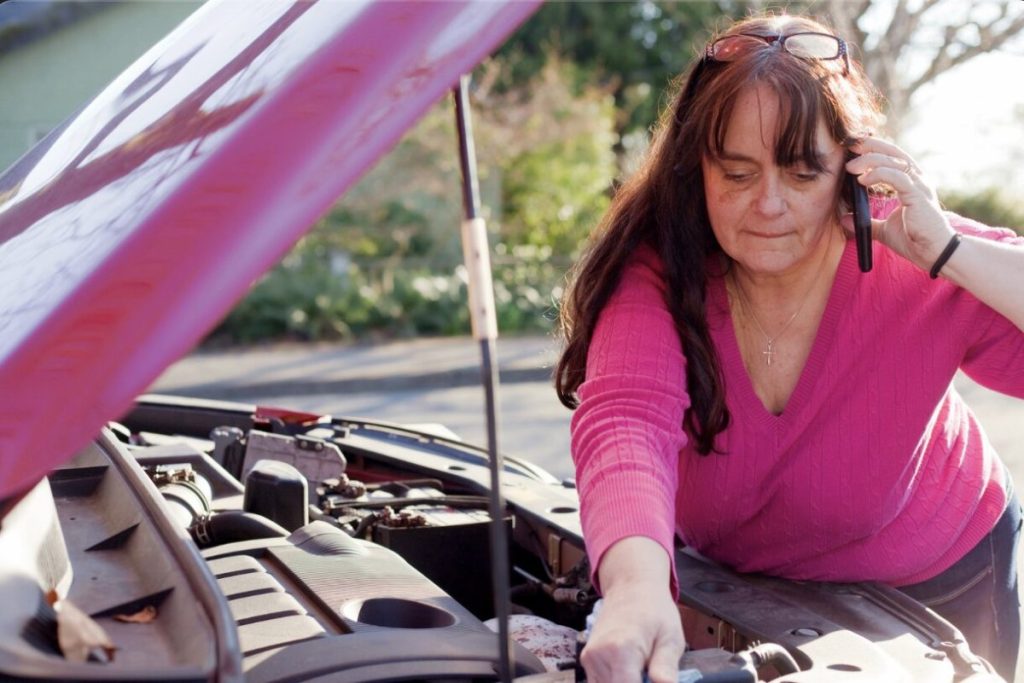
Imagine you’re driving around and all of the sudden you see that orange light appear on your dashboard. That light delivers a message of mystery and dread: “Check engine.” It could mean something very wrong is happening to your car. Then again, it could just be a loose gas cap.
Sure, a loose gas cap is usually the best case scenario, but you still wasted time and may even be saddled with an unnecessary bill from your mechanic. Still, ignoring the check engine light entirely is dangerous. It could mean you vehicle is unsafe or damaged. The longer you ignore it, the more damage (and cost) can build up. So, what can you do?
Luckily, there are things you can investigate yourself when the check engine light comes on. When you know what to do, you have a better chance of identifying and eliminating easy-to-solve problems. thus saving yourself a trip to the mechanic and any big bills that might come with it. If you find the problem is over your head, you then know without a doubt an expert’s eye is needed.
That said, here is what to check for when your check engine light suddenly comes on:
Make sure the gas cap is tightly on
As mentioned above, the check engine light could be on when your gas cap isn’t. Double check to make sure it’s screwed on tight every time you fill up the tank. If the light pops back on after you tighten the gas gap, check it again. Examine the gas cap’s rubber seal for any debris, cracks, or hardening. If it’s sealed tight and the light’s still on, you’ve got a different issue on your hands.
Check your oxygen sensors
Oxygen sensors help keep the air-fuel mixture in balance in modern engines. If there is a problem with it, it can’t accurately measure exhaust oxygen which can lead to inefficient combustion, higher emissions, and other issues. Other telltale signs of an oxygen sensor issue include more frequent fill-ups, rough idling when the engine is already warmed, and rotten egg-like smell coming from the tail pipe.
Take a look at your oxygen sensors for corrosion or damage. They’re typically in the exhaust system near the catalytic converter or exhaust manifold, but look through your car’s manual to make sure. Make sure the wires connected to them aren’t cut or damaged either. If everything looks good but the oxygen sensor looks dirty, clean it with the proper cleaner. That might do the trick.
However, if the oxygen sensor is damaged, it might be time for a pro or a trip to the autoparts store if you’re handy. But if they look good and you’re not experiencing any of the symptoms, it could be a different problem.
Examine the car battery
The check engine light can come on if there is an issue with your car battery. Check to see if everything is connected and make sure there’s no corrosion. You’ll also want the battery tested, perhaps at an auto parts shop or through services like AAA. If the battery is clean, connected, and powered-up, then your search for what’s causing the check engine light continues.
See if it’s a dirty catalytic converter
A check engine light can come on when the catalytic converter is damaged. If it is ,then there are likely other issues with your car that helped cause that damage. Sometimes, though, the catalytic converter isn’t damaged—it could just be dirty. If so, a good cleaning could fix the issue.
You’ll have to purchase a cleaner specialized for catalytic converters from an auto parts store or online. It should cost you around $30 (and will likely be cheaper than a visit to the auto repair shop.)
If the clean catalytic converter doesn’t do the trick, there’s something more that’s causing the check engine light.
Analyze your mass air flow (MAF) sensor for dirt, bugs, and leaves
The mass air flow (MAF) sensor is installed in the air cleaner duct or housing so it can meter the air that enters your engine. Depending on your car’s make and model, it could have a VAF Signal Voltage style sensor or the less common Karman Vortex air flow sensor. If there is no sign of damage but the sensor is dirtied by the elements, the check engine light could be resolved by giving it a good clean. However, know which type of MAF sensor you have because a Karman Vortex air flow sensor should NOT be cleaned.
It’s important to note that the MAF sensor is delicate and requires a cleaner that is specifically made for it. An auto parts store can help you find the right cleaner and provide you with additional tips. Depending on your handiness, it might not be worth doing this yourself.
Know when you need to pay a pro for safety’s sake
If you have done these checks and the light is still on, it’s time to get a professional. Ignoring a check engine light can be incredibly dangerous. It could lead to further damage to the car and possibly an accident if left unattended.
“Never ignore a warning light. It’s the biggest mistake car owners make and if it’s left too long, a small fix can quickly become a big bill,” automotive specialist Luke Oswald tells GOOD.
If it’s time for a mechanic, be sure to be extra cautious driving your vehicle to them. You may want to get your car towed to them, especially if the check engine light is flashing. Many cars also have built-in diagnostic capabilities that can report trouble codes and even schedule service appointments through them, saving you time.
No one wants to pay more than they need to, however safety should always be a top priority.