As the cost of living in major cities continues to climb, the value of a dollar in the U.S. varies dramatically depending on where you spend it. While cost of living indices have tried to measure this for years, they often lack the flexibility to provide a clear, user-friendly comparison across different locations.
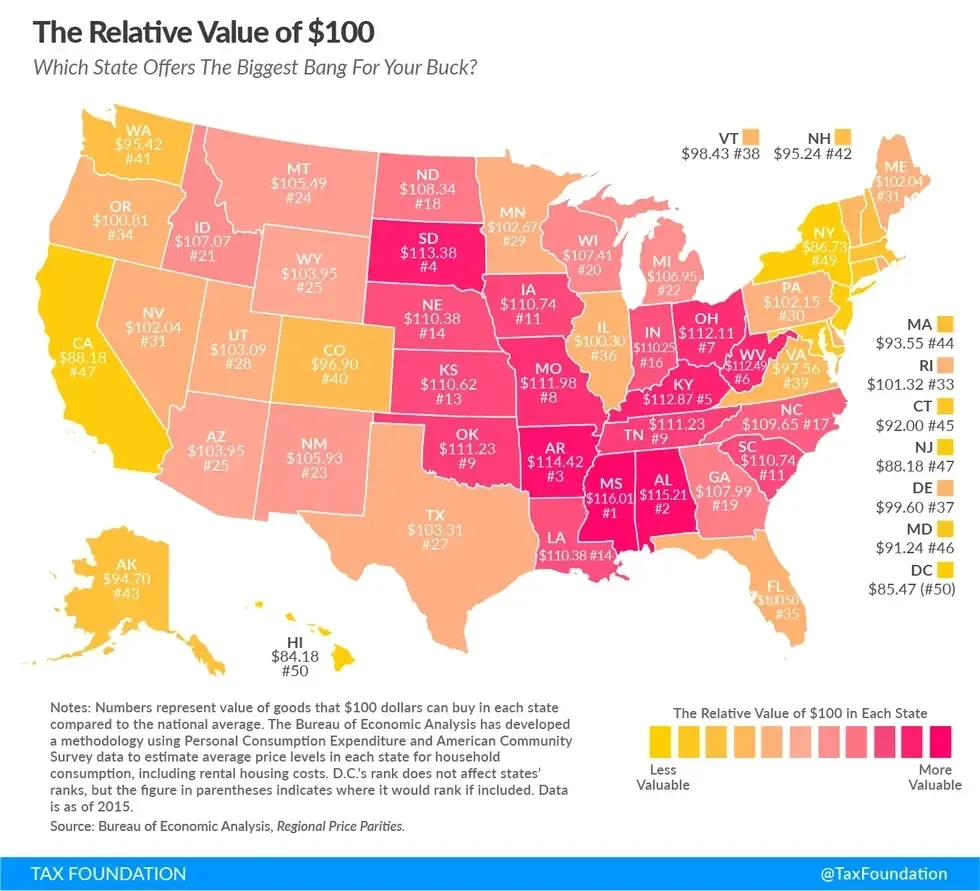
The Tax Foundation tackled these limitations by using the latest 2015 Bureau of Economic Analysis data to create a U.S. map showing how far $100 goes in each state. While the state-by-state approach doesn't capture local variations—for instance, $100 goes further in Fresno than Los Angeles—it still offers a useful snapshot of where your money stretches the most.
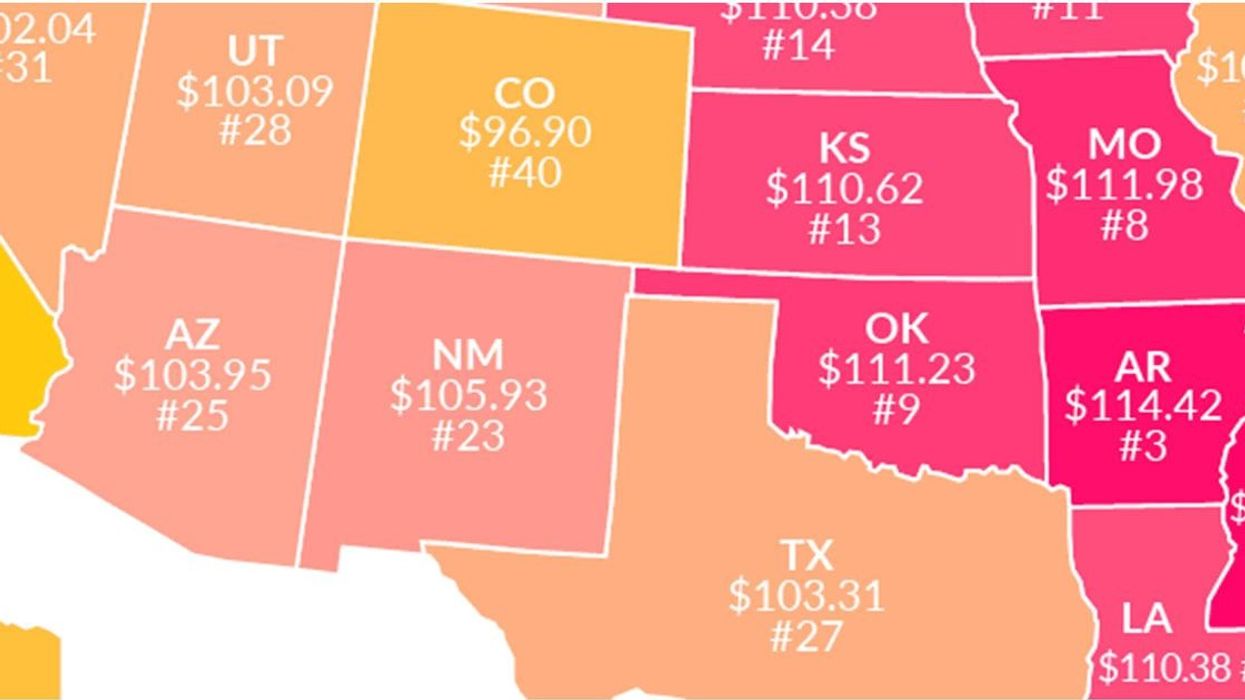
While the map might confirm some assumptions, it simplifies the geographic cost of living. For a beach lifestyle without California's high costs, consider Florida, where purchasing power is about average for the US. In a "Brewster's Millions"-type scenario, spending quickly in Hawaii, D.C., or New York is easy; you'll burn through your money in no time. If stretching your dollar matters, Mississippi offers a 16.1% higher purchasing power than the national average.
The Tax Foundation notes that if you're using this map for a practical purpose, bear in mind that incomes also tend to rise in similar fashion, so one could safely assume that wages in these states are roughly inverse to the purchasing power $100 represents.
This article originally appeared seven years ago.
More on Good.is
Why Should Women Read The Economist?
Transparency: The Growth of Food Stamps
The Economics of Porn: Better than the Economics of Other Stuff







 A symbol for organ donation.Image via
  A line of people.Image via
  "You get a second chance."


 Some plastic containers.Representational Image Source: Pexels I Photo by Nataliya Vaitkevich
 Man with a plastic container.Representative Image Source: Pexels | Kampus Production
 Canva
Canva It's easy to let little things go undone. Canva

 Photo by
 Teens are waiting longer than at any point in the survey’s history. Canva
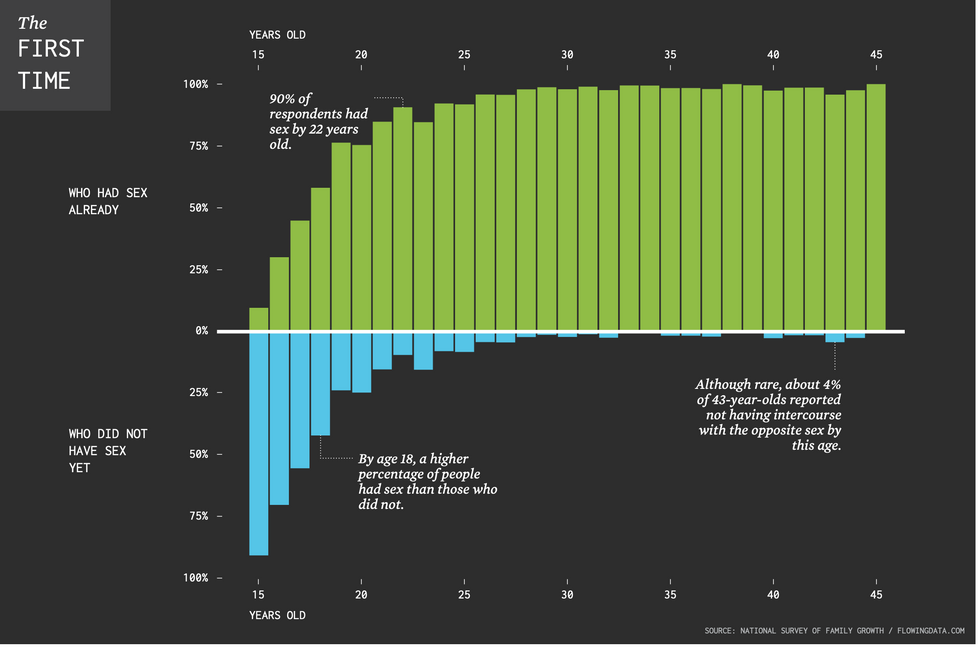 Chart on the age of a person’s first time having sex.National Survey of Family Growth/flowing data.com | Chart on the age of a person’s first time having sex.
 Kids know the good adults from the bad.