The Mass Shooting Tracker defines a mass shooting as “four or more people killed or injured by gunfire in a single incident.”
According to data from the United Nations Office on Drugs and Crimes (UNODC), the United States has the highest gun ownership rate in the world—an average of 88 per 100 people. As the publication Small Arms Survey points out, the United States accounts for less than 5 percent of the world’s population and is home to 35 to 50 percent of the world’s civilian-owned guns.
The following visualization shows every mass shooting that took place in the United States in 2015. The results are staggering.
To recap:
January: 24 incidents over 31 days
February: 18 incidents over 28 days
March: 30 incidents over 30 days
April: 18 incidents over 30 days
May: 39 incidents over 31 days
June: 42 incidents over 30 days
July: 45 incidents over 31 days
August: 41 incidents over 31 days
September: 38 incidents over 30 days
October: 23 incidents over 30 days
November: 33 incidents over 30 days
December: 11 incidents over 16 days...so far
In total, there were 362 incidents over 348 days, making that an average of 1.04 mass shootings per day.
The time for action has already expired. Contact your representative to voice your opinion and incite some long-overdue change.


 Screenshots of the man talking to the camera and with his momTikTok |
  Screenshots of the bakery Image Source: TikTok |
 A woman hands out food to a homeless personCanva
 A female artist in her studioCanva
 A woman smiling in front of her computerCanva
  A woman holds a cup of coffee while looking outside her windowCanva
  A woman flexes her bicepCanva
  A woman cooking in her kitchenCanva
  Two women console each otherCanva
  Two women talking to each otherCanva
  Two people having a lively conversationCanva
  Two women embrace in a hugCanva
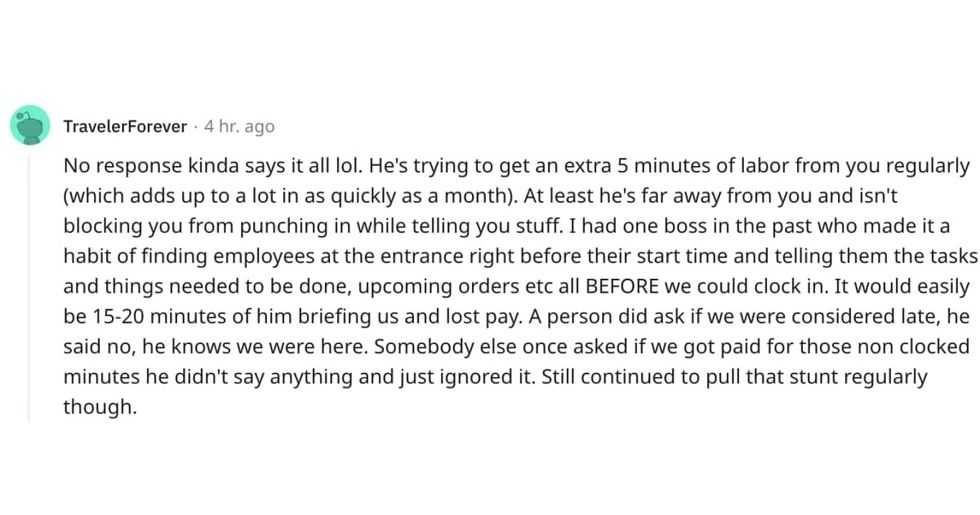
 A reddit commentReddit |
  A Reddit commentReddit |
  A Reddit commentReddit |
  Stressed-out employee stares at their computerCanva
 Who knows what adventures the bottle had before being discovered.
 Gif of young girl looking at someone suspiciously via

 A bartender makes a drinkCanva