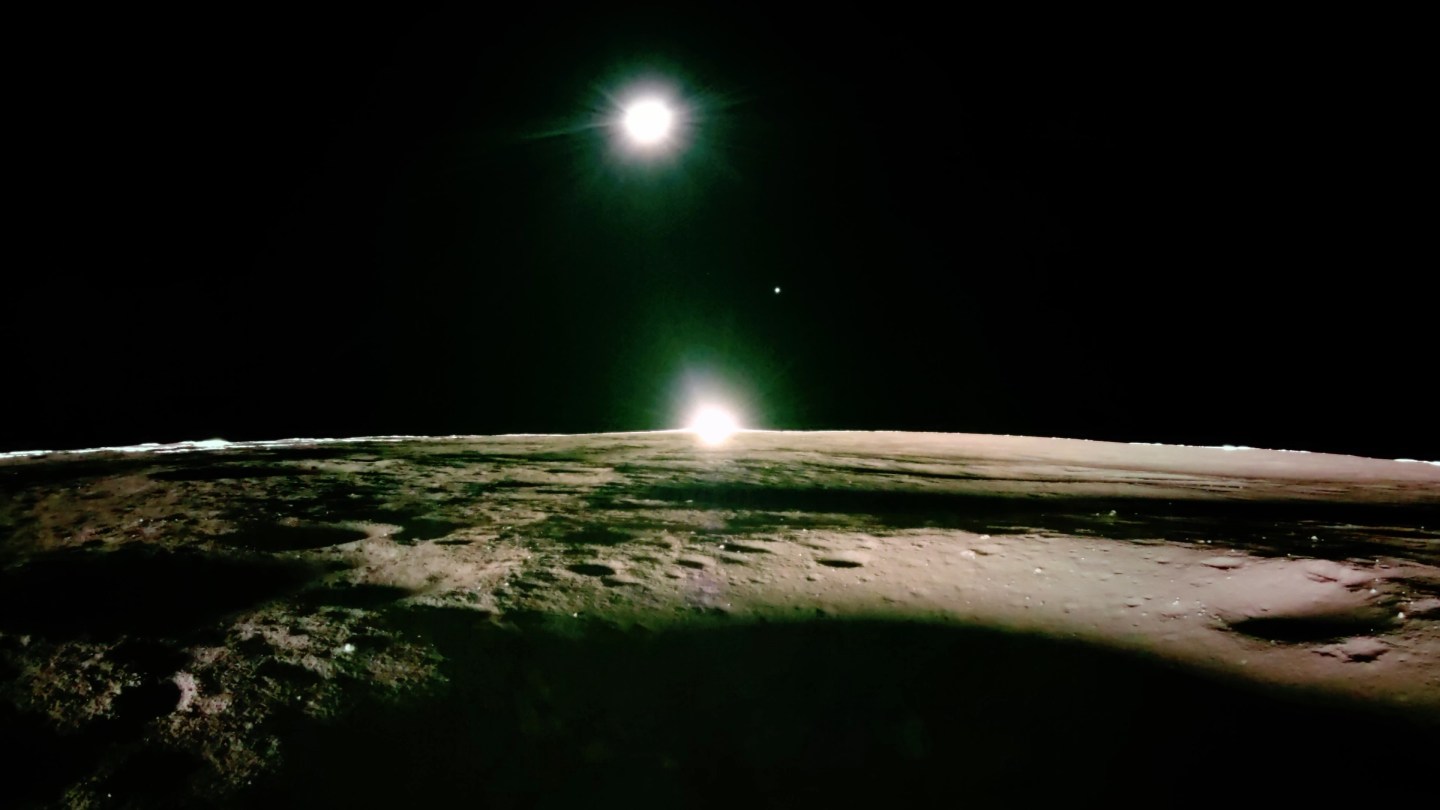
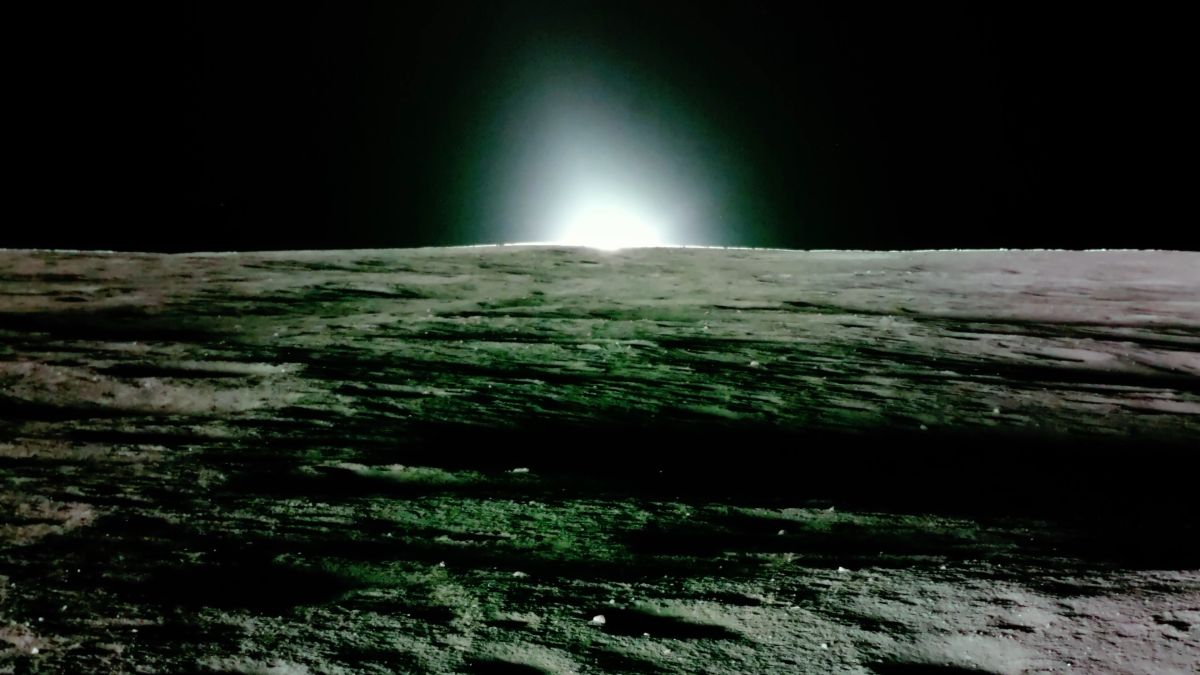
NASA and Firefly Aerospace have released the first high-definition photos of a lunar sunset from the Moon. The striking images, some of which show Earth and Venus in the distance, were taken by the private lander Blue Ghost and presented during a press conference Tuesday (March 18) at the Johnson Space Center in Houston—the celebratory end of a 14-day mission.
“These images, captured by different camera angles and stitched together in a video, show a horizon glow that comes to life just above the Moon’s surface as the sun goes down,” Firefly wrote on their website. On social media, they took a more casual tone, enthusing, “Sunsets hit differently on the Moon!”
Blue Ghost launched in January from Cape Canaveral, Florida, as part of NASA’s CLPS (Commercial Lunar Payload Services) initiative and Artemis campaign. It touched down March 2 on the Moon’s northeastern near side near Mons Latreille, a volcanic feature in the Mare Crisium region, and delivered 10 NASA science and technology instruments, capturing videos and photos during the two-week mission before going silent due to a lack of solar energy. According to The Associated Press, it became the first private spacecraft to land upright and perform its full mission.
“We’re incredibly proud of the demonstrations Blue Ghost enabled from tracking GPS signals on the Moon for the first time to robotically drilling and collecting science deeper into the lunar surface than ever before,” said Firefly CEO Jason Kim in a statement. “We want to extend a huge thank you to the NASA CLPS initiative and the White House administration for serving as the bedrock for this Firefly mission. It has been an honor to enable science and technology experiments that support future missions to the Moons, Mars, and beyond.”
Joel Kearns, NASA’s deputy associate administrator for exploration, Science Mission Directorate, described the sunset photos as “the first high-definition images taken of the sun going down and then going into darkness at the horizon,” The Guardian reports. “The images themselves are beautiful, they’re really aesthetic, but I know there are a bunch of folks looking at them now that study the Moon … Now it’s time for the specialists in the field to examine it and compare it to the other data we have from the mission and see what conclusions they can propose and draw from.”
The imagery, per Firefly, will help NASA determine “whether lunar dust levitates due to solar influences and creates a lunar horizon glow,” which was hypothesized by Gene Cernan—one of the two humans to most recently step foot on the Moon, during the Apollo 17 mission from December 1972.
NASA aims to continue a pace of two private lunar landers each year, with the understanding that some missions will fail, The AP reports. “It really does open up a whole new way for us to get more science to space and to the Moon,” said Nicky Fox, associate administrator, NASA Science Mission Directorate.
In February 2020, NASA Goddard’s YouTube channel posted an incredible video that, using data from the Lunar Reconnaissance Orbiter spacecraft, approximates what the Apollo 13 astronauts saw while flying around the far side of the Moon. “Nearly brings a tear to my eye,” wrote one viewer.
The test was introduced in a 2005 paper in the Journal of Economic Perspectives by Yale professor Shane Frederick. It’s designed to test your ability to override a quick, intuitive gut reaction and engage in deeper, more analytical thought.
Want to try it yourself?
Woman sits in front of her computer thinking Canva
Here are the three questions:
A bat and a ball together cost $1.10. The bat costs $1.00 more than the ball. How much does the ball cost?
If it takes five machines five minutes to make five widgets, how long would it take 100 machines to make 100 widgets?
In a lake, there is a patch of lily pads. Every day, the patch doubles in size. If it takes 48 days for the patch to cover the entire lake, how long would it take for the patch to cover half of the lake?
The Answers and Why They’re So Tricky
If you answered 10 cents, 100 minutes, and 24 days, you’re in the majority—and you’ve fallen for the trap. Those are the common intuitive answers. The correct answers are 5 cents, 5 minutes, and 47 days.
Woman proudly shows testy results Canva
Here’s the breakdown:
The Bat and Ball: If the ball cost 10 cents, the bat (at $1.00 more) would cost $1.10, for a total of $1.20. The correct math shows the ball is 5 cents and the bat is $1.05.
The Widgets: The rate of production is one widget per machine every five minutes. Therefore, 100 machines can produce 100 widgets in the same five-minute timeframe.
The Lily Pads: Since the patch doubles in size every day, it must have been half its final size just one day before it covered the whole lake—on day 47.
The Science of Your Brain
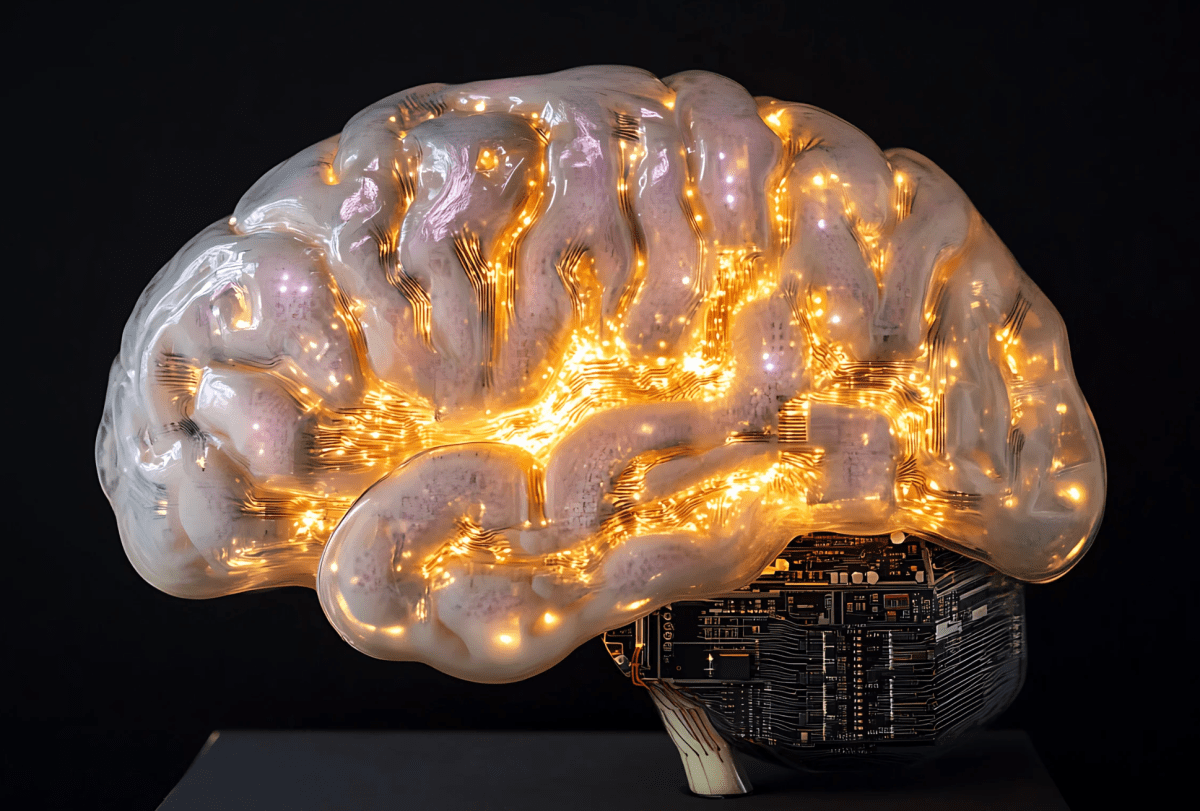
An artistic representation of the brain Canva
This test brilliantly illustrates the two modes of thinking identified by Nobel Prize-winning psychologist Daniel Kahneman.System 1 is our fast, automatic, intuitive thinking, which gives us the quick (but wrong) answers.System 2 is our slower, more deliberate, and analytical thinking, which is required to solve the puzzles correctly.
As Frederick explains, the test measures how we make decisions based on instinct versus analysis. “System 1 thinkers respond spontaneously, often making mistakes, while System 2 thinkers engage in effortful thought processes,” he wrote.
Frederick’s research found that those with stronger cognitive reflection skills (System 2 thinkers) tend to be more patient and willing to take calculated risks. His work aims to understand the real-world impact of our cognitive styles, noting, “Despite the diversity of phenomena related to IQ, few have attempted to understand—or even describe—its influences on judgment and decision making.”
So, whether you passed the test or not, it offers a fascinating glimpse into the constant tug-of-war between gut reaction and careful thought that happens inside our brains every day.
This article originally appeared earlier this year.
This article originally appeared [time-difference] ago. It has been updated.
Earth still holds remarkable secrets beneath its surface—and sometimes beneath its oceans. In 2017, scientists confirmed the existence of a hidden continent beneath the South Pacific. Now known as Zealandia, this mostly submerged landmass was found hiding in plain sight and has since been dubbed “the eighth continent.” A study published in Tectonics helped solidify its status, offering a new perspective on Earth’s ever-evolving geography.
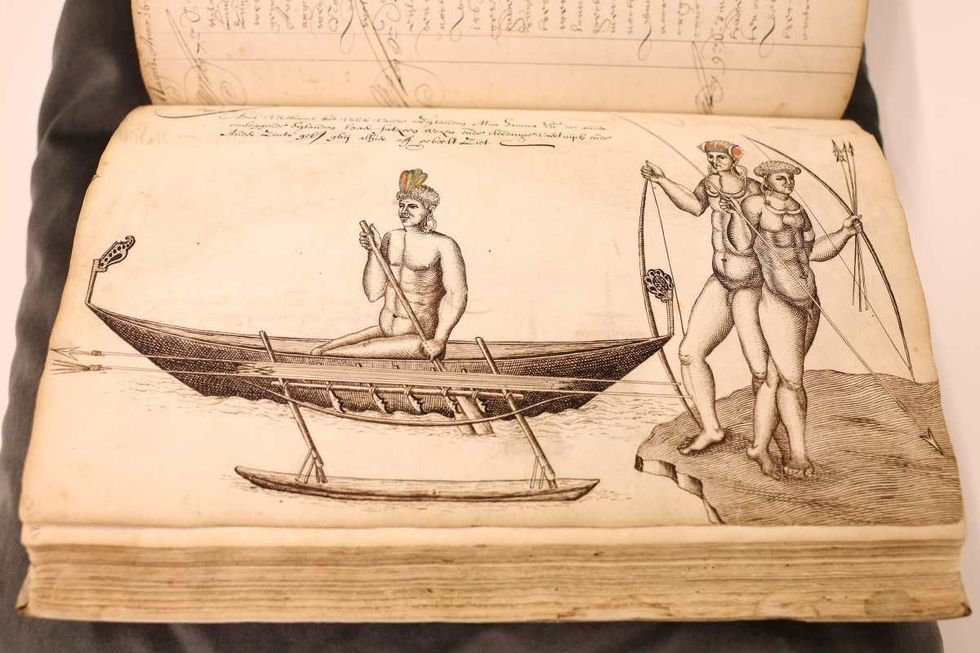
Although the researchers discovered this new continent in 2017, the hunt began almost 400 years ago. In 1642, Dutch captain Abel Tasman (seen in the above portrait), serving the East India Company, was ordered to explore a Southern Continent. On August 14, 1642, Tasman departed from Batavia with two ships sailing west to Mauritius in the Indian Ocean, according to Princeton University Library.
Tasman named the location “Moordenaers (Murderers) Bay,” and sailed home, never to return to this land, although he did believe that he had discovered a great new continent.
Naming and defining Zealandia
It was nearly 375 years after Tasman’s voyage that geologists stumbled upon this mainland. They announced the discovery by naming it “Zealandia,” based on the suggestion of American geophysicist Bruce Luyendyk who described this region in 1995. Zealandia is translated to “Te Riu-a-Māui” in the Māori language.
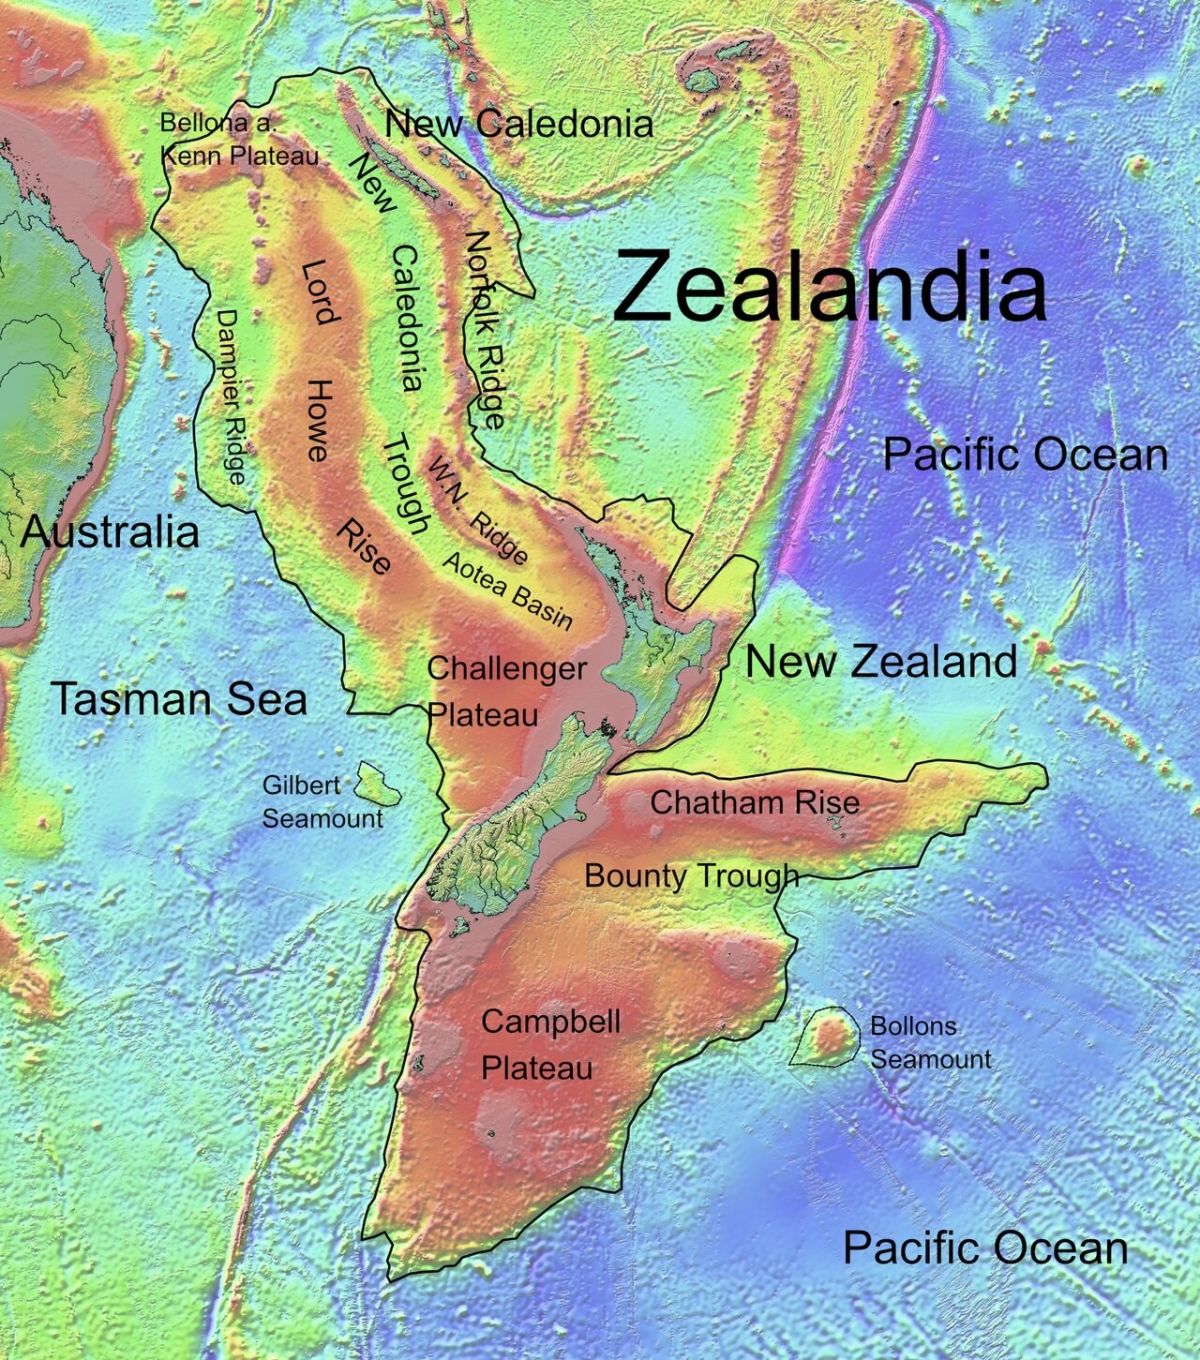
Zealandia lies mostly submerged off the east coast of Australia Public Domain
In a paper, researchers from GNS Science of New Zealand documented that they had to dredge rock samples from the Fairway Ridge to the Coral Sea to analyze the rock geochemically and understand the underwater makeup of Zealandia. Led by Nick Mortimer, they scanned the northern two-thirds of the submerged area, where they unearthed pebbly and cobbley sandstone, fine-grain sandstone, mudstone, bioclastic limestone, and basaltic lava from a variety of periods as concluded by their radiocarbon dating.
Ancient rocks with a story to tell
The rocks and stones were found to be roughly 95 million years old, from the Late Cretaceous period. The granite and volcanic pebbles were estimated to be 130 million years old, the Early Cretaceous period. The basalts however were newer, probably about 40 million years old, and from the Eocene period. “It is kind of cool,” said Mortimer, per BBC. Andy Tulloch, a geologist at the New Zealand Crown Research Institute GNS Science, who was part of the research team, added, “This is an example of how something very obvious can take a while to uncover.”
Mostly submerged, yet massive
Although Zealandia is a vast continent that spans an expanse stretched for 4.9 million square kilometers, around six times the size of Madagascar, most of it is submerged under the South Pacific Ocean. Only the area at the Ball’s Pyramid on Lord Howe Island rises above the water’s veil. It is the smallest, thinnest, and youngest of all known continents.
Usually, the continental crust is about 40 kilometers deep, thicker than the oceanic crust which is about 10 kilometers. The researchers proposed that since Zealandia ended up stretched too much, its crust became thinner, around 20 kilometers, and finally disappeared under the sea. With 95 percent of its territory submerged beneath the ocean’s depths, Zealandia prowls on planet Earth as a lair possessing an enigmatic charm of mysterious historical elements and ancient stories.
This article originally appeared last year.
This article originally appeared 1 year ago. It has been updated.
A commercial airplane crash can change how people behave long after the immediate tragedy. News outlets replay the images, people affected share their harrowing stories, and an extraordinarily rare event becomes easy to imagine. Some travelers cancel trips; others drive to their destination instead.
These choices may feel cautious. Statistically, the alternatives people switch to may come with greater risk.
Commercial airline crashes command attention because they are rare, catastrophic and beyond a passenger’s control. But the choice to avoid flying does not eliminate risk. As a new report from our research team at Embry-Riddle Aeronautical University outlines, skipping a flight and opting to drive instead is typically much riskier, even if it doesn’t feel like it.
Airline travel is safer than headlines suggest
People tend to respond strongly to events that are vivid, while paying less attention to familiar hazards – the risks of which manifest more frequently but less visibly. As a result, efforts to avoid one danger can create another.
In our recent peer-reviewed report, prepared with support from Embry-Riddle Aeronautical University’s Boeing Center for Aviation and Aerospace Safety, we compared fatality risk in U.S. commercial aviation with other transportation modes, recreational activities, household hazards and occupational risks. While the Boeing Center receives some funding from The Boeing Company, it operates independently.
We focused on commercial Part 121 airlines operating in the U.S. and analyzed data from 2016 through 2025. Part 121 carriers generally include large U.S. airlines and regional carriers that operate scheduled passenger service. Because fatal accidents are so rare, data from a single year would not have provided a stable risk estimate.
Across several measures of risk exposure, including distance traveled, individual boardings, hours spent traveling, annual risk and lifetime odds, the data consistently shows that U.S. commercial aviation is exceptionally safe.
For the same distance traveled, we estimated the fatality risk as about 626 times higher in a passenger car or truck than on a commercial airline. The risk associated with motorcycle travel was more than 22,000 times higher than commercial airline travel. Even highway bus travel, itself a relatively safe option, carried about nine times the risk of commercial airline travel over the same distance.
When risk is measured per passenger boarding, the numbers remain striking. From 2016 through 2024, the long-run estimate was approximately one passenger fatality per 97.7 million boardings on commercial airlines.
These numbers do not mean flying is risk-free, just that the risk is small enough that researchers need many years and enormous amounts of exposure to estimate it. Across the 10-year study period, 73 people died in accidents involving commercial airline travel in the United States.
These findings complement earlier research. A peer-reviewed 2013 study comparing U.S. transportation modes examined data from 2000 through 2009 and also identified commercial aviation as the safest way to travel. A 2018 study using data from the same period similarly ranked commercial aviation as the safest mode.
More recently, a 2022 study analyzed U.S. news coverage, travel patterns and accident data from 1996 through 2017. It found that increased news coverage of aviation accidents was associated with more road traffic and more fatal road accidents in subsequent months.
The 9/11 aftermath and the risk of avoiding risk
The aftermath of the Sept. 11, 2001, terrorist attacks provided a powerful example of how behavior can shift risk from one setting to another. Air travel declined sharply after the 9/11 attacks. Subsequently, researchers were able to investigate whether fear of flying led to additional deaths on the road.
Psychologist Gerd Gigerenzer analyzed traffic patterns for the final three months of 2001 and estimated 353 excess road deaths nationwide. He characterized many people’s decision to drive rather than fly as an attempt to avoid a “dread risk”: a low-probability event in which many people could die at once.
Transportation researchers Michael Sivak and Michael Flannagan later reanalyzed the period. They used road fatality trends from the first eight months of 2000 and 2001 to estimate how many deaths would normally have occurred during the final three months of 2001. They then compared that estimate with the number actually recorded in the past three months and calculated 1,018 additional road fatalities from October 2001 through December 2001.
But their findings complicated the idea that people who avoided flying merely drove to the same distant destinations. Much of the increase occurred on local roads, not interstate highways, and pedestrians and bicyclists experienced a disproportionate share of fatalities. This pattern suggests that travel behavior may have changed more broadly after the attacks, perhaps because people canceled longer trips, stayed closer to home or changed their daily routines.
It is hard to pin down how much of this increase was related to people changing their travel patterns in response to the 9/11 attacks, since these studies cannot track each individual’s transportation decisions.
But both studies suggest that a collective effort to avoid a highly visible danger can increase exposure to ordinary hazards whose victims are less visible. When more people choose to drive rather than fly, the roads become busier and the number of traffic deaths can rise.
The question shapes the risk estimate
One reason discussions about risk become confusing is that there is no single way to measure it. The answer to the question “Is it safe?” depends on what you measure.
How much risk does a person face for each mile traveled? What is the risk of one trip? How much risk accumulates during one hour of travel? What is the chance of dying from this cause in a year or over a lifetime?
These are legitimate questions, but to make a valid comparison, you need to look at the same measure of risk for both types of transportation. Comparing the risk of one flight with the annual risk of driving, for example, mixes unlike quantities.
A traveler deciding whether to fly or drive between two cities can compare the two modes over the same trip or distance. This comparison provides a clearer perspective than comparing a highly visible plane crash with a familiar daily routine.
Time matters too. In our estimates, an hour in a passenger car or truck carried about 74 times the fatality risk of an hour aboard a commercial aircraft.
Feeling in control is not the same as safety
Driving gives people a steering wheel, a brake pedal and the belief that their skill can protect them. Flying asks passengers to place control in the hands of pilots, airlines, regulators, air traffic controllers and a complex technical system. Psychological research has linked a stronger sense of agency – the feeling that people control their actions and their outcomes – with greater risk-taking. That difference in perceived control helps explain why a rare aviation disaster can feel more threatening than routine road travel.
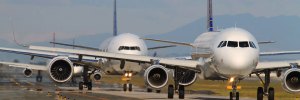
Airline passengers don’t have the same sense of control over their vehicle as drivers, so flying can feel more uncertain and dangerous. AP Photo/Susan Walsh
Media attention also matters. A major airplane crash is treated as news of national or international importance. Road deaths occur across many locations and at different times, so the public does not see the cumulative toll.
The emotional intensity of coverage does not mean journalists are wrong to cover crashes. It just means audiences need context alongside the images.
Crafting better risk communication
Telling anxious travelers that flying is “safe” is rarely enough. Research on risk perception shows that people do not judge danger through statistics alone. Fear and vivid images also shape how risky an event feels. But providing more context about the risks from other forms of transportation can still help.
Effective communication about risk does not minimize tragedy or dismiss the real fear people may feel. But it can help people understand that when millions of travelers shift from one type of transportation to another, the risk moves with them.
For travelers, the practical question is not whether an option has zero risk. No option does. The question is whether a choice reduces their total exposure to risk or merely replaces a frightening, highly visible risk with a greater one that feels routine.
To put the rarity of fatal airline events into perspective, an average of 2.48 million travelers passed through TSA screening each day in 2025. Modern commercial aviation in the United States has achieved a safety record that is difficult to grasp precisely because fatal events are so unusual.
When fear leads people away from that system, the safest-feeling decision may not be the safest decision at all.