In the last year, we've released a new infographic every Tuesday. Here is a look back at the ones that drew the most attention, on topics from water footprints to bankruptcies (click on the images to launch the infographics).
1: Sea Mail
2: Walk This Way
This piece (also by Fogelson-Lubliner), helped readers figure out how their daily choices could help reduce their water footprints.
3: The Largest Bankruptcies in History
After the collapse of Lehman Brothers, this piece, by Always With Honor, looked at the largest bankruptcies in history as sinking ships. See all of the work Always With Honor has done with GOOD here.
4: Let Them Eat Meat!
Zut Alors!'s piece on which countries eat the most meat revealed some interesting facts about worldwide animal consumption. Here in the United States, we each eat the equivalent of a whole pig, 25 chickens, and a hot dog every year. To see all of Zut Alors!'s work for GOOD, go here.
5: Through the Gyre
This fascinating explanation of the Great Pacific Garbage patch, with illustrations by Jacob McGraw-Mickelson, gave readers a helpful guide to the Texas-sized patch.
6: All the News...
This piece looked back at the most-covered stories of 2009, from Obama's innauguration to balloon boy. It was designed by Naz ?ahin and ?erifcan Özcan.
7: One Nation, Under God
This piece, by Chris Korbey, examined the growth in numbers of different religions in America, especially the number of people who say they are atheists or have no religion. See all of Korbey's work for GOOD here.
8: Who Is Coming to America?
Timko and Klick looked at patterns of immigrants to the United States. See more of their work for GOOD here.
9: No More Fish in the Sea
Also by Timko and Klick, this piece looked at the declining fish stocks of a number of important species.
10: Death Row
This graphic, by Kiss Me I'm Polish, showed the state of the death penalty in different countries around the world. See all of Kiss Me I'm Polish's work for GOOD here.
You can see all of GOOD's infographics on Flickr, or in our Transparency archive.





 TikTok · Bring Back Doors


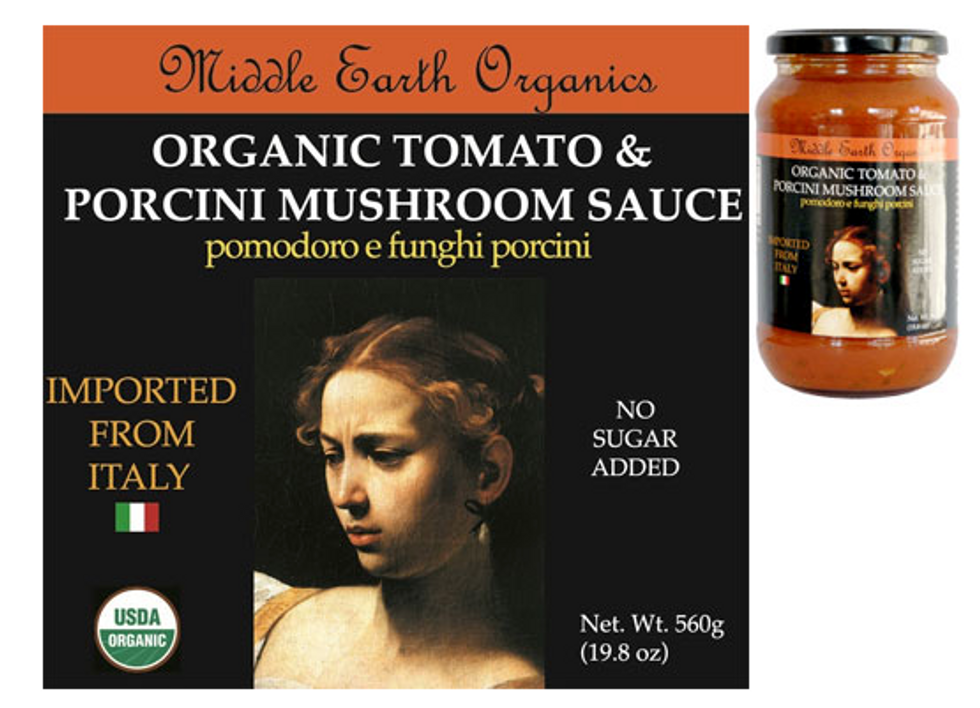 Label for Middle Earth Organics' Organic Tomato & Porcini Mushroom Sauce
 "Judith Beheading Holofernes" by Caravaggio (1599)