Sometimes, restaurant customers face long waits, leading to stress and frustration. While minor annoyance is expected, some customers’ behavior can cross the line of respect. When a restaurant in Brewster faced recurring incidents of staff mistreatment by rude customers, they decided to shut down for a “day of kindness,” as reported by WHDH. This move went viral, with other restaurant owners sharing similar experiences of rampant mistreatment in the service industry.

Representative Image Source: Pexels | Olly

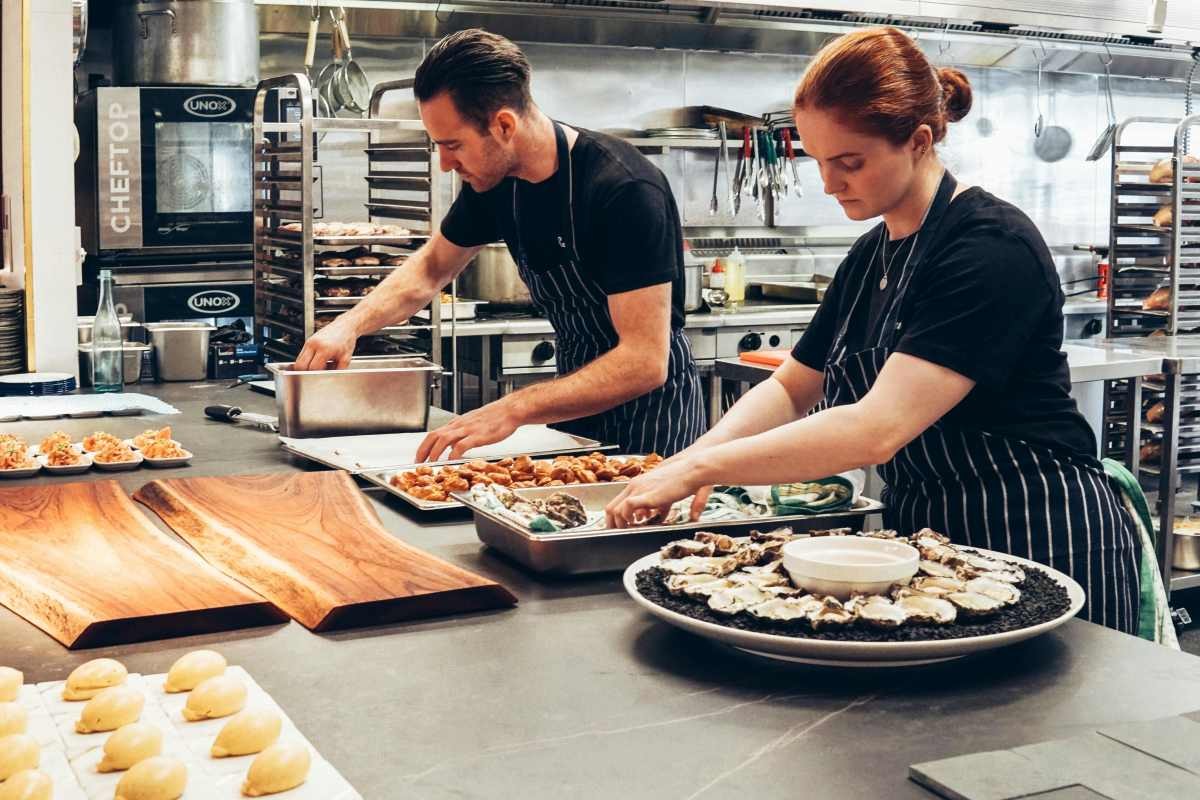
Ideally, it is not a server’s job description to put up with customers who belittle them or show rude behavior. But in July 2021, the servers of Apt Cape Cod, a farm-to-table restaurant in Massachusetts, had to bear such a huge emotional toll that they ended up getting overwhelmed and crying. Some impatient and disrespectful customers shoved away their frustrations on the servers in the most discourteous manner. The situation was exacerbated by the pandemic. “Patrons have crossed the line from being rude or upset to verbally abusive,” owner Regina Felt Castellano told WHDH. “They told one of our workers, ‘I hope you get hit by a car when you leave work today’.”


via GIPHY


But it was the last straw when one man lambasted one of the restaurant’s young employees. “The server had told the customer that he could not take his breakfast takeout order because the restaurant had not opened yet,” Brandi Felt Castellano, the co-owner, told The New York Times, adding, “I never thought it would become this.” Following the incident, the restaurant’s owners put up a notice on Facebook, announcing that they were shutting down the restaurant for a few hours as a “day of kindness.” The now-deleted post read, “Apt Cape Cod will be closed for breakfast this morning. We will be opening for dinner at 5 pm,” per the New York Post.

Representative Image Source: Pexels | Elle Takes Photos

“This is an unacceptable way to treat any human,” they wrote in the post, elaborating that there had been an “astronomical influx” of customers who swore, threatened, yelled, and argued with their staff regularly. They told TODAY that they chose to close because they wanted to value “employees over money” and hoped to “spread a message of kindness and change the culture that restaurant workers should just have to take abuse because of the job they chose.”


via GIPHY


The post went viral, resonating with other restaurant owners who shared similar experiences, especially post-pandemic. A 2020 research from the Institute of Customer Service even showed that more than half of customer-facing employees report increased incidences of abuse since the start of the pandemic. “We’re hearing from Pennsylvania, Ohio, Las Vegas, like all over the country people are like ‘it’s happening to us too’,” Felt Castellano told WHDH.

Representative Image Source: Pexels | ELEVATE

But this was not always the case. Earlier in the pandemic, customers overwhelmingly exhibited kindness, Brandi told The New York Times. But after the restaurants in the state were allowed to fully reopen in May 2021, customers’ treatment of their servers worsened. “It’s like abuse,” she said. “It’s things that people are saying that wouldn’t be allowed to be on TV because they would be bleeped. People are always rude to restaurant workers, but this far exceeds anything I’ve seen in my 20 years.”


[iframe https://giphy.com/embed/frB0pfCD5EoxZnHu90 allowfullscreen=”allowfullscreen” class=”giphy-embed” frameborder=”0″ height=”100%” style=”position: absolute;” width=”100%”]

via GIPHY


She added that customers had no idea what was going on behind the scenes. Due to the pandemic, the restaurant was grappling with staffing and supply shortages. This often led to longer wait times and the unavailability of certain menu items, which prompted many impatient customers to threaten and berate the servers. “I would say that it is its own epidemic,” said Brandi.


At the same time, many of the restaurant’s customers demonstrated their respect by gestures like dropping off ice-cream shop gift cards for the restaurant’s employees, and tickets to a parasail and Jet Ski shop in the next town, Brandi revealed. “A lot of people,” she said, “have been like, ‘Thanks for saying what we’ve all been wanting to say.’ ”


Sadly, the Apt Cape’s servers are not alone in facing this rude behavior from customers. Darren Cardosa, a long-time server who runs a blog titled “The Bitchy Waiter,” told TODAY during the pandemic, “We’ve all seen these viral videos of servers being assaulted or yelled at by customers who are upset about masks or how long they had to wait for their table.” He added, “There is this sense in the whole country right now that there’s a lot of anger and frustration, and it seems like a lot of customers feel like it’s okay to take that out on their server.”

  • The salary you need to live comfortably in 100 US cities
    A view of the San Antonio River walkway in San Antonio, Texas.
    ,

    The salary you need to live comfortably in 100 US cities

    Big-city comfort comes with a six-figure price tag.

    Jaclyn DeJohn, CFP for SmartAsset

    To truly understand the context of a household’s income, it must be compared to local costs and long-term goals, which both may fluctuate over time. For most people, the same pillars will make up the biggest nonnegotiables in their budget. These include basic necessities like housing, groceries, utilities, and transportation, and likely some discretionary spending on hobbies, activities, and other enrichment. In an attempt to secure this lifestyle for the future, many households aim to save some of their income for emergencies, investments, retirement, education, and other long-term goals. A common budgeting technique that encapsulates these three pillars is called the 50/30/20 rule: 50% of your post-tax income goes to needs, 30% to your wants, and 20% gets set aside for the future.

    With this in mind, SmartAsset assessed the salary needed to reach this 50/30/20 ideal — designated as a comfortable salary — based on the local costs in 100 of the largest U.S. cities.

    Key Findings

    • A single adult needs to earn $150,000 to live comfortably in these places. New York has the highest individual salary needed to live comfortably at $158,954. San Jose, California, follows closely at $158,080. Orange County cities Irvine, Anaheim, and Santa Ana require an estimated $151,965 in income for a single adult.
    • These cities have the lowest salary needed to live comfortably. San Antonio has the lowest salary threshold for both single adults and families of four at $83,242 and $192,608, respectively. New Orleans has the second-lowest salary needed for a single adult to live comfortably at $84,406, followed by Memphis, Tennessee, at $86,320.
    • The Bay Area is the most expensive place for a family to live comfortably. Bay Area cities make up the top four of the five places with the highest salary needed for a family of four to live comfortably. Incomes across two parents are projected at $407,597 in San Francisco, $402,771 in San Jose, and $371,488 in both Fremont and Oakland. Boston rounds out the top five at $368,742.
    • Families in these Texas cities are closest to a comfortable salary. In Frisco, the median household earns $145,444 — substantially higher than the national median of $83,730. This figure also accounts for 63.1% of the $230,464 income a family of four in Frisco needs to live comfortably. In McKinney, the $124,177 median household income accounts for 53.9% of the $230,464 needed.
    Table listing the top cities by the lowest annual salary needed for a single adult to live in sustainable comfort using the 50/30/20 budgeting rule.

    10 Cities With the Highest Salary Needed to Live Comfortably

    1. New York, New York

    • Salary needed for a single adult: $158,954
    • Salary needed for a working family of four: $337,875
    • Median household income: $81,228

    2. San Jose, California

    • Salary needed for a single adult: $158,080
    • Salary needed for a working family of four: $402,771
    • Median household income: $148,226

    3. (tie) Irvine, California

    • Salary needed for a single adult: $151,965
    • Salary needed for a working family of four: $327,226
    • Median household income: $145,731

    3. (tie) Anaheim, California

    • Salary needed for a single adult: $151,965
    • Salary needed for a working family of four: $327,226
    • Median household income: $101,145

    3. (tie) Santa Ana, California

    • Salary needed for a single adult: $151,965
    • Salary needed for a working family of four: $327,226
    • Median household income: $95,118

    6. Boston, Massachusetts

    • Salary needed for a single adult: $139,776
    • Salary needed for a working family of four: $368,742
    • Median household income: $97,791

    7. (tie) San Diego, California

    • Salary needed for a single adult: $136,781
    • Salary needed for a working family of four: $312,915
    • Median household income: $111,032

    7. (tie) Chula Vista, California

    • Salary needed for a single adult: $136,781
    • Salary needed for a working family of four: $312,915
    • Median household income: $105,101

    9. San Francisco, California

    • Salary needed for a single adult: $134,950
    • Salary needed for a working family of four: $407,597
    • Median household income: $139,801

    10. (tie) Fremont, California

    • Salary needed for a single adult: $134,410
    • Salary needed for a working family of four: $371,488
    • Median household income: $175,816

    10. (tie) Oakland, California

    • Salary needed for a single adult: $134,410
    • Salary needed for a working family of four: $371,488
    • Median household income: $102,235

    10 Cities With the Lowest Salary Needed to Live Comfortably

    1. San Antonio, Texas
    • Salary needed for a single adult: $83,242
    • Salary needed for a working family of four: $192,608
    • Median household income: $66,176
    1. New Orleans, Louisiana
    • Salary needed for a single adult: $84,406
    • Salary needed for a working family of four: $197,766
    • Median household income: $58,821
    1. Memphis, Tennessee
    • Salary needed for a single adult: $86,320
    • Salary needed for a working family of four: $193,939
    • Median household income: $52,679
    1. Oklahoma City, Oklahoma
    • Salary needed for a single adult: $86,861
    • Salary needed for a working family of four: $213,325
    • Median household income: $70,040
    1. Baltimore, Maryland
    • Salary needed for a single adult: $87,485
    • Salary needed for a working family of four: $224,224
    • Median household income: $64,778
    1. Louisville, Kentucky
    • Salary needed for a single adult: $88,234
    • Salary needed for a working family of four: $212,742
    • Median household income: $67,251
    1. Tulsa, Oklahoma
    • Salary needed for a single adult: $88,317
    • Salary needed for a working family of four: $215,238
    • Median household income: $60,930
    1. Winston-Salem, North Carolina
    • Salary needed for a single adult: $88,442
    • Salary needed for a working family of four: $205,421
    • Median household income: $57,758
    1. Tucson, Arizona
    • Salary needed for a single adult: $88,899
    • Salary needed for a working family of four: $218,400
    • Median household income: $60,483
    1. Fort Wayne, Indiana
    • Salary needed for a single adult: $88,982
    • Salary needed for a working family of four: $233,126
    • Median household income: $61,436

    Data and Methodology

    SmartAsset used MIT Living Wage Calculator data to gather the basic cost of living for an individual with no children and for two working adults with two children. Data includes the cost of necessities, including housing, food, transportation, and income taxes. It was last updated to reflect the most recent data available on Feb. 15, 2026.

    Applying these costs to the 50/30/20 budget for 100 of the largest U.S. cities, MIT’s living wage is assumed to cover needs (i.e., 50% of one’s budget). From there, the total annual wage was extrapolated for individuals and families to spend 30% of the total on wants and 20% on savings or debt payments. Median household income data for cities comes from the U.S. Census Bureau’s 1 Year American Community Survey for 2024.

    This story was produced by SmartAsset and reviewed and distributed by Stacker.

  • 8 ways to squeeze more miles from every tank, according to America’s fleet pros
    Man inflating car tires at a gas station.

    Kelly Soderlund for Samsara

    The trucking industry has turned fuel efficiency into a science. Here’s what everyday drivers can borrow from their playbook.

    Diesel hit $5.03 per gallon for U.S. commercial fleets in early 2026 — and fuel already eats up roughly 21–24% of what motor carriers spend just to operate. That financial pressure turned fuel management into one of the most carefully engineered problems in the trucking industry. Fleet operators have cameras, sensors, and software all pointed at one question: How do you stop wasting fuel?

    The answers they’ve landed on aren’t mysterious or trucking-specific. Most of them apply just as well to a Honda Civic as to an 18-wheeler. Samsara shares eight things the pros do that you can start doing today.

    1. Stop idling. Seriously.

    This one sounds obvious until you add up how often you actually do it. Sitting in a drive-through, waiting for someone outside a building, letting the car “warm up” before a winter drive — it all adds up. Commercial trucks burn close to a gallon of fuel per hour while idling, and the widely held belief that idling is easier on an engine than restarting is flat-out wrong. Restarting costs less.

    Fleet companies track idling per driver and flag anything that looks excessive. At home, the rule of thumb is simple: If you’re stopped for more than a minute and going nowhere, shut it off.

    2. Drive like you’re trying to protect a full cup of coffee on the dashboard.

    The way you use your right foot is probably the single biggest variable in your fuel economy. Hard acceleration, speeding, and aggressive braking can reduce fuel efficiency by as much as 40%, according to the U.S. Department of Energy. That’s nearly half your gas budget.

    Commercial fleets coach their drivers specifically on smooth throttle inputs: gradual acceleration, cruise control on highways, and coasting into stops instead of braking late and hard. The physics don’t care what size vehicle you’re driving.

    3. Pay attention to your own numbers.

    One discovery from the fleet world: When you show drivers their own efficiency scores, they improve without being told to. Companies that introduced driver performance dashboards and friendly competition between drivers saw measurable gains — one fleet tracked a jump from 6 MPG to 7.5 MPG after making individual scores visible.

    Most cars already give you this data. If yours has a fuel economy display, watch it. If you want to go further, note your mileage at each fill-up and calculate your MPG manually. Setting a personal monthly target and trying to beat it month over month is genuinely effective, mostly because awareness changes behavior.

    4. Think like a dispatcher when you plan your errands.

    The cheapest gallon of fuel is the one you never have to buy. Commercial dispatchers obsess over route efficiency because unnecessary miles are pure cost with no upside. That logic applies in your driveway, too.

    Before you run errands, spend 90 seconds thinking about the most logical order — fewest backtracks, least highway-to-city switching, combining stops you’d otherwise make on separate days. Apps like Google Maps and Waze handle the turn-by-turn, but the trip consolidation decision is yours to make before you leave.

    5. Find cheaper gas before you’re running on empty.

    Fuel prices can vary by 30 cents or more per gallon within just a few miles. Fleet operators now route drivers toward lower-cost fuel stops using real-time price data. You can do the exact same thing with GasBuddy, Waze’s gas prices layer, or the gas station search in Google Maps, which pulls in nearby prices.

    The habit that makes this work: Check prices before your tank is low, not after. Desperation-fueling — stopping at whatever’s convenient when the warning light is on — is reliably the most expensive way to fill up.

    6. Watch for fraud at the pump.

    This is less about efficiency and more about not losing money you didn’t know you were losing. Fuel theft and card skimming at gas stations are more common than most drivers realize, and fraudulent charges from a compromised card often go unnoticed for weeks. Fleet companies use real-time transaction alerts to flag unusual purchases immediately.

    For personal use, a few practical habits help: Use tap-to-pay instead of swiping when the terminal allows it (skimming devices can’t read contactless transactions), check your bank and credit card statements weekly, and consider a card with real-time transaction notifications turned on.

    7. Your tire pressure is costing you money right now.

    Here’s a number that tends to surprise people: For every 1 PSI drop in tire pressure, your vehicle loses roughly 0.4% of its fuel efficiency. Tires lose pressure slowly and steadily — a few PSI over a few months is completely normal and easy to miss. By the time you notice a tire looks low, it’s been costing you at the pump for weeks.

    Fleet maintenance teams tie tire pressure checks directly to fuel economy because the correlation is consistent and measurable. For personal vehicles, checking tire pressure once a month takes about five minutes. While you’re at it, a clogged air filter, old engine oil, or worn spark plugs all carry similar slow-drain effects on efficiency that a routine tune-up addresses.

    8. Track your MPG over time — and notice when it changes.

    Fleets benchmark fuel performance across their vehicles and flag outliers: a truck getting meaningfully fewer miles per gallon than similar trucks is likely developing a mechanical problem before it becomes a breakdown. The fuel data is an early warning signal.

    Your car works the same way. If you track your MPG over several fill-ups and see a notable drop without a change in how or where you’re driving, something is usually going on mechanically. Catching it at the “slightly worse MPG” stage is almost always cheaper than catching it at the “broken down on the highway” stage.

    Fuel cost analysis and fleet efficiency data referenced in this article are drawn from Samsara’s research on commercial fleet fuel management.

    This story was produced by Samsara and reviewed and distributed by Stacker.

  • The happiest cities in America in 2026, ranked across 11 factors
    A sunrise view of a row of cherry blossom trees and the Rosslyn skyline reflected in the Tidal Basin in Virginia.
    ,

    The happiest cities in America in 2026, ranked across 11 factors

    Arlington leads a data-driven look at where Americans may be happiest.

    Jaclyn DeJohn, CFP for SmartAsset

    Happiness may not be easy to quantify, but some qualifiers may make a person more likely to feel satisfied in life. A reasonable degree of financial freedom can alleviate worry about day-to-day costs and the occasional unexpected expense. Similarly, good relationships, overall health and longevity, basic conveniences, and privacy can go a long way in keeping stress down and contentment up. While none of these things alone are the secret to happiness, they may all individually contribute to a life geared toward wants rather than needs — freeing up time and resources for individuals to explore and build a life on their own terms.

    With this in mind, SmartAsset ranked 85 of the largest U.S. cities with available data based on 11 happiness factors spanning personal finance, physical and mental well-being, and quality of life factors.

    Key Findings

    • Arlington, VA, ranks as the happiest city for 2026. Arlington ranks among the top five cities for a variety of happiness metrics, including life expectancy (83.9 years), household earnings over $100,000 (64.3%), mentally healthy days (84.9%), adults getting exercise (83%), and access to activity spaces (100%).
    • Fremont, CA, households outearn their peers. Ranking second overall for happiest cities, 70.7% of Fremont households earn over $100,000, the most studywide. This pairs with the lowest poverty rate of 4.7%. However, 18.1% of households in Fremont end up spending 50% or more of their income on housing. In tandem, the population maintains the highest rate of health insurance coverage and marriage, at 98.1% and 63.8%, respectively.
    • Austin, TX, has the least traffic. The traffic volume per meter in Austin, Texas — a practice ground for many autonomous vehicle companies — is lowest studywide at 42.1. This pales in comparison to Boston, which has over 40 times the traffic volume per meter at 1753.9. The average traffic volume per meter is 299.
    • Residents have the most mentally healthy days in Honolulu. Ranking 16th happiest overall, Honolulu residents feel mentally healthy for 85.2% of days. San Jose, California, follows closely at 85% mentally healthy days. On the other end of the spectrum, the residents of Toledo, Ohio, have the worst mental health ranking, at 78.2% of days spent mentally healthy.
    • These California cities have the most overcrowding in housing. Privacy and space can go a long way in making a person comfortable in their own space, and can be indicative of financial resources. In Long Beach, Los Angeles, and Fresno, just over 10% of households are home to more than one person per bedroom. Laredo, Texas, also falls into this category of high overcrowding. Meanwhile, Pittsburgh has the lowest rate of overcrowding at 0.9%.
    Table listing the top cities where Americans are happiest.

    Top 25 Happiest Cities

    1. Arlington, VA
    • Households earning $100k+: 64.3%
    • Poverty rate: 8.3%
    • Households spending >50% of income on housing: 14.2%
    • Poor mental health days: 15.1%
    • Life expectancy (years): 83.9
    • Percent of adults getting exercise: 83%
    • Population with health insurance: 93.9%
    • Marriage rate: 44.2%
    • Traffic volume per meter: 540
    • Access to activity space: 100%
    • Overcrowded households: 3.4%
    1. Fremont, CA
    • Households earning $100k+: 70.7%
    • Poverty rate: 4.7%
    • Households spending >50% of income on housing: 18.1%
    • Poor mental health days: 17.8%
    • Life expectancy (years): 82
    • Percent of adults getting exercise: 81.2%
    • Population with health insurance: 98.1%
    • Marriage rate: 63.8%
    • Traffic volume per meter: 683
    • Access to activity space: 99.6%
    • Overcrowded households: 7.7%
    1. San Jose, CA
    • Households earning $100k+: 64.2%
    • Poverty rate: 8.1%
    • Households spending >50% of income on housing: 15.7%
    • Poor mental health days: 15%
    • Life expectancy (years): 83.8
    • Percent of adults getting exercise: 80.9%
    • Population with health insurance: 95.6%
    • Marriage rate: 48.6%
    • Traffic volume per meter: 626.4
    • Access to activity space: 99.4%
    • Overcrowded households: 7.9%
    1. Seattle, WA
    • Households earning $100k+: 57.1%
    • Poverty rate: 9.4%
    • Households spending >50% of income on housing: 15%
    • Poor mental health days: 16.6%
    • Life expectancy (years): 81.1
    • Percent of adults getting exercise: 86.7%
    • Population with health insurance: 96.3%
    • Marriage rate: 39.5%
    • Traffic volume per meter: 333
    • Access to activity space: 97.9%
    • Overcrowded households: 3.9%
    1. Raleigh, NC
    • Households earning $100k+: 43%
    • Poverty rate: 13.3%
    • Households spending >50% of income on housing: 12%
    • Poor mental health days: 15.7%
    • Life expectancy (years): 81
    • Percent of adults getting exercise: 84.2%
    • Population with health insurance: 92.9%
    • Marriage rate: 38.8%
    • Traffic volume per meter: 111.6
    • Access to activity space: 98.6%
    • Overcrowded households: 2%
    1. Boise, ID
    • Households earning $100k+: 39.9%
    • Poverty rate: 12.9%
    • Households spending >50% of income on housing: 10.9%
    • Poor mental health days: 17.1%
    • Life expectancy (years): 79.7
    • Percent of adults getting exercise: 82.4%
    • Population with health insurance: 93.1%
    • Marriage rate: 44.2%
    • Traffic volume per meter: 116.7
    • Access to activity space: 91.6%
    • Overcrowded households: 1.9%
    1. Lincoln, NE
    • Households earning $100k+: 33.5%
    • Poverty rate: 13.4%
    • Households spending >50% of income on housing: 12.6%
    • Poor mental health days: 15.3%
    • Life expectancy (years): 79.1
    • Percent of adults getting exercise: 78.9%
    • Population with health insurance: 93.4%
    • Marriage rate: 47%
    • Traffic volume per meter: 211.1
    • Access to activity space: 95.4%
    • Overcrowded households: 2.2%
    1. Anchorage, AK
    • Households earning $100k+: 53.9%
    • Poverty rate: 8.3%
    • Households spending >50% of income on housing: 13.2%
    • Poor mental health days: 16.3%
    • Life expectancy (years): 76.3
    • Percent of adults getting exercise: 80.1%
    • Population with health insurance: 90.6%
    • Marriage rate: 48.7%
    • Traffic volume per meter: 152.3
    • Access to activity space: 93.9%
    • Overcrowded households: 4.5%
    1. San Francisco, CA
    • Households earning $100k+: 61%
    • Poverty rate: 11.3%
    • Households spending >50% of income on housing: 16.9%
    • Poor mental health days: 16.6%
    • Life expectancy (years): 82.4
    • Percent of adults getting exercise: 83.6%
    • Population with health insurance: 97.2%
    • Marriage rate: 39.1%
    • Traffic volume per meter: 794
    • Access to activity space: 100%
    • Overcrowded households: 6.8%
    1. Minneapolis, MN
    • Households earning $100k+: 40.3%
    • Poverty rate: 15.1%
    • Households spending >50% of income on housing: 13.4%
    • Poor mental health days: 16.1%
    • Life expectancy (years): 79.5
    • Percent of adults getting exercise: 83.3%
    • Population with health insurance: 94.3%
    • Marriage rate: 34%
    • Traffic volume per meter: 304.6
    • Access to activity space: 99.1%
    • Overcrowded households: 2.7%
    1. Colorado Springs, CO
    • Households earning $100k+: 41.6%
    • Poverty rate: 8.8%
    • Households spending >50% of income on housing: 14.4%
    • Poor mental health days: 18.4%
    • Life expectancy (years): 76.2
    • Percent of adults getting exercise: 81.5%
    • Population with health insurance: 91.5%
    • Marriage rate: 52.6%
    • Traffic volume per meter: 140.9
    • Access to activity space: 89.8%
    • Overcrowded households: 2.5%
    1. Aurora, CO
    • Households earning $100k+: 46.4%
    • Poverty rate: 10.7%
    • Households spending >50% of income on housing: 15.6%
    • Poor mental health days: 17.1%
    • Life expectancy (years): 79.1
    • Percent of adults getting exercise: 82.4%
    • Population with health insurance: 85.6%
    • Marriage rate: 44.9%
    • Traffic volume per meter: 215.2
    • Access to activity space: 97.5%
    • Overcrowded households: 3%
    1. Charlotte, NC
    • Households earning $100k+: 43.7%
    • Poverty rate: 11.9%
    • Households spending >50% of income on housing: 14.3%
    • Poor mental health days: 16.3%
    • Life expectancy (years): 78.8
    • Percent of adults getting exercise: 81.1%
    • Population with health insurance: 87.9%
    • Marriage rate: 40.4%
    • Traffic volume per meter: 165.5
    • Access to activity space: 88.7%
    • Overcrowded households: 2.3%
    1. Omaha, NE
    • Households earning $100k+: 35.5%
    • Poverty rate: 14.2%
    • Households spending >50% of income on housing: 13.1%
    • Poor mental health days: 15.9%
    • Life expectancy (years): 77.7
    • Percent of adults getting exercise: 75.7%
    • Population with health insurance: 91.2%
    • Marriage rate: 44.3%
    • Traffic volume per meter: 214.9
    • Access to activity space: 97.4%
    • Overcrowded households: 2.1%
    1. Chula Vista, CA
    • Households earning $100k+: 52%
    • Poverty rate: 9.6%
    • Households spending >50% of income on housing: 20.8%
    • Poor mental health days: 17.3%
    • Life expectancy (years): 80.3
    • Percent of adults getting exercise: 81.7%
    • Population with health insurance: 94.8%
    • Marriage rate: 50.2%
    • Traffic volume per meter: 440.1
    • Access to activity space: 97.5%
    • Overcrowded households: 6.9%
    1. Honolulu, HI
    • Households earning $100k+: 44.5%
    • Poverty rate: 10.5%
    • Households spending >50% of income on housing: 19.4%
    • Poor mental health days: 14.8%
    • Life expectancy (years): 81.7
    • Percent of adults getting exercise: 77.8%
    • Population with health insurance: 96.8%
    • Marriage rate: 45.1%
    • Traffic volume per meter: 536.2
    • Access to activity space: 96.6%
    • Overcrowded households: 8.7%
    1. San Diego, CA
    • Households earning $100k+: 55.3%
    • Poverty rate: 10.4%
    • Households spending >50% of income on housing: 20.8%
    • Poor mental health days: 17.3%
    • Life expectancy (years): 80.3
    • Percent of adults getting exercise: 81.7%
    • Population with health insurance: 94.3%
    • Marriage rate: 43.9%
    • Traffic volume per meter: 440.1
    • Access to activity space: 97.5%
    • Overcrowded households: 6.9%
    1. Lexington, KY
    • Households earning $100k+: 34.2%
    • Poverty rate: 12.1%
    • Households spending >50% of income on housing: 14.7%
    • Poor mental health days: 17.4%
    • Life expectancy (years): 76.7
    • Percent of adults getting exercise: 77.1%
    • Population with health insurance: 91.9%
    • Marriage rate: 42.5%
    • Traffic volume per meter: 163.7
    • Access to activity space: 97.4%
    • Overcrowded households: 2.2%
    1. Mesa, AZ
    • Households earning $100k+: 41.9%
    • Poverty rate: 10.8%
    • Households spending >50% of income on housing: 14.2%
    • Poor mental health days: 18.2%
    • Life expectancy (years): 77.5
    • Percent of adults getting exercise: 78%
    • Population with health insurance: 89%
    • Marriage rate: 48.5%
    • Traffic volume per meter: 244.2
    • Access to activity space: 92.8%
    • Overcrowded households: 4.4%
    1. Pittsburgh, PA
    • Households earning $100k+: 33.2%
    • Poverty rate: 20.1%
    • Households spending >50% of income on housing: 11.9%
    • Poor mental health days: 17.9%
    • Life expectancy (years): 76.9
    • Percent of adults getting exercise: 79%
    • Population with health insurance: 96%
    • Marriage rate: 33.6%
    • Traffic volume per meter: 202.3
    • Access to activity space: 93.3%
    • Overcrowded households: 0.9%
    1. Denver, CO
    • Households earning $100k+: 46.8%
    • Poverty rate: 12.1%
    • Households spending >50% of income on housing: 16.3%
    • Poor mental health days: 18.3%
    • Life expectancy (years): 77.4
    • Percent of adults getting exercise: 78.8%
    • Population with health insurance: 90.7%
    • Marriage rate: 40.5%
    • Traffic volume per meter: 415.7
    • Access to activity space: 99.1%
    • Overcrowded households: 3.1%
    1. Oakland, CA
    • Households earning $100k+: 51.2%
    • Poverty rate: 11.9%
    • Households spending >50% of income on housing: 18.1%
    • Poor mental health days: 17.8%
    • Life expectancy (years): 82
    • Percent of adults getting exercise: 81.2%
    • Population with health insurance: 94.1%
    • Marriage rate: 38.3%
    • Traffic volume per meter: 683
    • Access to activity space: 99.6%
    • Overcrowded households: 7.7%
    1. Spokane, WA
    • Households earning $100k+: 38.4%
    • Poverty rate: 12.7%
    • Households spending >50% of income on housing: 13.9%
    • Poor mental health days: 19.9%
    • Life expectancy (years): 76.9
    • Percent of adults getting exercise: 79.6%
    • Population with health insurance: 93.7%
    • Marriage rate: 41.9%
    • Traffic volume per meter: 150.4
    • Access to activity space: 87.6%
    • Overcrowded households: 2.1%
    1. Atlanta, GA
    • Households earning $100k+: 45.4%
    • Poverty rate: 15.8%
    • Households spending >50% of income on housing: 17.3%
    • Poor mental health days: 15.9%
    • Life expectancy (years): 77.5
    • Percent of adults getting exercise: 80%
    • Population with health insurance: 91.4%
    • Marriage rate: 31.8%
    • Traffic volume per meter: 384
    • Access to activity space: 93.8%
    • Overcrowded households: 2%
    1. Henderson, NV
    • Households earning $100k+: 48.3%
    • Poverty rate: 8.8%
    • Households spending >50% of income on housing: 18.5%
    • Poor mental health days: 18.4%
    • Life expectancy (years): 76.6
    • Percent of adults getting exercise: 73%
    • Population with health insurance: 94.2%
    • Marriage rate: 48%
    • Traffic volume per meter: 196.6
    • Access to activity space: 95.7%
    • Overcrowded households: 4.4%

    Data and Methodology

    Eighty-five of the largest U.S. cities for which data was available were evaluated across three categories: personal finance, well-being, and quality of life. Data comes from the U.S. Census Bureau 1-Year American Community Survey for 2024 and the County Health Rankings & Roadmaps for 2025.

    Personal finance metrics included:

    • Percent of individuals earning $100,000 or more.
    • Percent of households that spend 50% or more of their income on housing.
    • Percent of residents below the poverty level.

    Well-being metrics include:

    • Average percentage of days spent with poor mental health
    • Life expectancy in years.
    • Percentage of residents getting exercise.
    • Percentage of residents who have health insurance.

    Quality of life metrics include:

    • Marriage rate.
    • Average traffic volume per meter of major roadways in the county.
    • Percentage of population with adequate access to locations for physical activity.
    • Percentage of households with overcrowding, defined as more than one person living in a room.

    This story was produced by SmartAsset and reviewed and distributed by Stacker.

Explore More Money Stories

Smart Spending

8 ways to squeeze more miles from every tank, according to America’s fleet pros

Everyday Economics

The happiest cities in America in 2026, ranked across 11 factors

Money

Bank of America foreclosed on a couple’s home by mistake. So they got a court order and showed up to foreclose on the bank.

Money

A millionaire swapped lives with a struggling family for a week on a $230 budget. The money wasn’t what broke him.